[Home]
[Well Installation Report Index] [Next Section]
Final Well Installation Report
Section 4 - Results and Interpretation
Collection of geophysical and downhole camera data from the TO42 wells that were upgraded, installed, or made available to Parsons occurred through 30 logging runs made by Geo Cam, and five runs by COLOG. Geo Cam performed its logging over multiple mobilizations; COLOG�s work was completed with two mobilizations. The geophysical parameters recorded by Geo Cam were SP, gamma ray, caliper, and electrical resistivity. COLOG employed FEC, heat-pulse flow, and optical televiewing to generate its logs. Geo Cam also made nine video logs at eight wells. Table 4.1 summarizes the geophysical runs completed during the TO42 drilling effort. Normally a logging run only covers the formation most recently cored or about to be screened. Merging data from the individual runs through the formations created a composite geophysical log of an entire well. Logging runs by COLOG were complete through the entire depth of each WB corehole. The geophysical logs for wells installed under TO42 can be found in Appendix B.
Table 4.1 - Summary of TO42 Geophysical and Video Logs
| Well | Date | Depth Interval | Logging Parameters |
| CS-MW1-LGR | n/a | n/a | none |
| CS-MW1-BS | 10/18/02 | 0-348 (LGR) | Gamma, Caliper |
| 99-348 (LGR) | SP, Resistivity | ||
| 11/12/02 | 328-382 (BS) | Gamma, Caliper | |
| 320-382 (BS) | SP, Resistivity | ||
| CS-MW1-CC | 12/19/02 | 380-472 (CC) | Gamma, Caliper |
| 380-470 (CC) | SP, Resistivity | ||
| CS-MW2-LGR | n/a | n/a | none |
| CS-MW2-CC | 1/13/03 | 0-361 (LGR) | Gamma, Caliper |
| 75-361 (LGR) | SP, Resistivity | ||
| 2/27/03 | 361-402 (BS) | Gamma, Caliper, SP, Resistivity | |
| 3/5/03 | 402-492 (CC) | Gamma, Caliper, SP, Resistivity | |
| CS-MW11A-LGR | 3/19/03 | 0-408 (LGR) | Gamma, Caliper |
| 75-408 (LGR) | SP, Resistivity | ||
| 3/28/03 | 0-494 (LGR/BS) | Gamma, Caliper | |
| 20-494 (LGR/BS) | SP, Resistivity | ||
| 3/31/03 | 0-492 (LGR/BS) | Video | |
| CS-MW11B-LGR | 4/9/03 | 0-260 (LGR) | Gamma, Caliper |
| 94-260 (LGR) | SP, Resistivity | ||
| CS-MW12-LGR | 9/12/02 | 0-382 (LGR) | Gamma, Caliper |
| 116-382 (LGR) | SP, Resistivity | ||
| CS-MW12-BS | n/a | n/a | none |
| CS-MW12-CC | 9/26/02 | 380-501 (BS/CC) | Caliper, SP, Resistivity |
| 0-501 (LGR/BS/CC) | Gamma | ||
| CS-16-LGR | n/a | n/a | none |
| CS-MW16-CC | 4/16&17/03 | 0-343 (LGR) | Gamma, Caliper |
| 110-343 (LGR) | SP, Resistivity, HPF, FEC | ||
| 5/28/03 | 320-393 (BS) | Gamma, Caliper, SP, Resistivity | |
| 6/3/03 | 393-466 (CC) | Gamma, Caliper, SP, Resistivity | |
| CS-MW17-LGR | 8/15/02 | 0-401 (LGR) | Gamma, Caliper |
| 5-401 (LGR) | SP, Resistivity | ||
| CS-MW18-LGR | 7/23/02 | 0-422 (LGR) | Gamma, Caliper |
| 65-422 (LGR) | SP, Resistivity | ||
| 7/28/02 | 0-411 (LGR) | Video | |
| 6/24/03 | 0-410 (LGR) | Video (well inspection) | |
| CS-MW19-LGR | 8/2/02 | 0-380 (LGR) | Gamma, Caliper |
| 71-380 (LGR) | SP, Resistivity | ||
| CS-G-LGR | 8/21/02 | 0-339 (LGR) | Gamma, Caliper |
| 190-339 (LGR) | SP, Resistivity | ||
| CS-MWH-LGR | 9/6/02 | 0-382 (LGR) | Gamma, Caliper, Video |
| 195-382 (LGR/BS) | SP, Resistivity | ||
| CS-WB01 | 6/12/03 | 0-314 (LGR) | Gamma, Caliper, Video |
| 132-314 (LGR) | SP, Resistivity | ||
| 7/16/03 | 0-314 (LGR) | BIPS | |
| 7/16&17/03 | 139-314 (LGR) | HPF, FEC | |
| CS-WB02 | 6/20/03 | 0-313 (LGR) | Gamma, Caliper |
| 121-313 (LGR) | SP, Resistivity | ||
| 6/24/03 | 0-313 (LGR) | Video | |
| 7/20/03 | 0-313 (LGR) | BIPS | |
| 7/20-22/03 | 156-313 (LGR) | HPF, FEC | |
| CS-WB03 | 6/27/03 | 0-312 (LGR) | Gamma, Caliper |
| 101-312 (LGR) | SP, Resistivity | ||
| 6/30/03 | 0-312 (LGR) | Video | |
| 7/23/03 | 0-312 (LGR) | BIPS | |
| 7/23&24/03 | 106-312 (LGR) | HPF, FEC | |
| CS-WB04 | 7/17/03 | 0-513 (LGR/BS/CC) | Gamma, Caliper, Video |
| 157-513 (LGR/BS/CC) | SP, Resistivity | ||
| 7/18/03 | 0-513 (LGR/BS/CC) | BIPS | |
| 7/18&19/03 | 161-513 (LGR/BS/CC) | HPF, FEC | |
| LS-7 | 6/27/02 | 0-393 (LGR) | Gamma, Caliper |
| 212-393 (LGR) | SP, Resistivity | ||
| RFR-10 | 7/10&11/03 | 0-483 (LGR/BS/CC) | Gamma, Caliper, Video |
| 155-483 (LGR/BS/CC) | SP, Resistivity | ||
| JW-32 | 8/28/03 | 0-520 (LGR/BS/CC) | Gamma, Caliper |
| 246-520 (LGR/BS/CC) | SP, Resistivity | ||
| CS-I-LGR | 7/23/03 | 0-360 (LGR) | Gamma, Caliper |
| 258-357 (LGR) | SP, Resistivity | ||
| BIPS = Borehole Image Processing System (optical televiewer) HPF = Heat-pulse Flow. | |||
Geophysical logging was extremely useful. The logs identified formation thicknesses and contact depths (see Table 3.1). Significant features such as water-bearing zones, dry layers, subsurface voids, faults, and displacement distances within the subsurface were also located. Many of the prominent features allowed for correlation between CSSA wells contributing to the overall picture of subsurface conditions, most notably groundwater occurrence and movement. Geophysical results are analyzed and described in the CSSA HCSM (currently draft). Once completed, the CSSA HCSM will be incorporated into Volume 5 of the CSSA Environmental Encyclopedia.
4.2 - Discrete Interval Groundwater Sampling
A total of 52 DIGW samples were collected from selected hydrostratigraphic zones at 15 TO42 well locations. All samples were analyzed for target VOCs which included MEK, cis-1,2-DCE, trans‑1,2-DCE, PCE, TCE, and toluene. In addition, acetone, isopropyl alcohol, and toluene, were identified early on in the RL83 drilling program as tentatively identified compounds (TIC), and were subsequently added to the target list. Isopropyl alcohol is the primary ingredient of the foaming agent occasionally used during the drilling, and acetone is a by-product of the isopropyl alcohol degradation.
Attempts to collect samples from 20 other zones (28 percent) in various wells were aborted due to very poor yield or no flow at all. These low flow zones were typically found in the upper part of the LGR and throughout the BS. Table 4.2 shows a summary of the sample collection effort. Sampling interval depths in the following chronological narratives are referenced to depth below ground surface. Comprehensive chemical analysis data can be found in Appendix E.
Table 4.2 - TO42 Discrete Interval Groundwater Samples
July 2002 through July 2003
| Well No. | Interval Depth | Rock Unit | Interval Volume | Interval Volumes Purged | Total Purged | Average Purging Rate | Duration of Collection Attempt | Sampled | Date |
|
| (fbgs) |
| (gal) | (gal) | (gal) | (gpm) | (hrs, mins) | (Y/N) |
|
| MW18-LGR | 77 - 89 | LGR | 8.6 | 23.3 | 200 | 8.0 | 25min | Y | 07/24/02 |
| 239 - 251 | LGR | 8.6 | 0 | 0 | n/a | 25min | N | ||
| 379 - 391 | LGR | 8.6 | 38.4 | 330 | 6.5 | 1hr 6min | Y | ||
| 401 - 413 | LGR | 8.6 | 34.9 | 300 | 5.5 | 55min | Y | ||
| MW19-LGR | 113 - 125 | LGR | 8.6 | 0 | <1 | <� | 25min | N | 08/05/02 |
| 195 - 207 | LGR | 8.6 | 0 | packer damaged | 15min | N | |||
| 195 - 207 | LGR | 8.6 | 0 | <1 | <� | 15min | N | 08/06/02 | |
| 312 - 324 | LGR | 8.6 | 32.6 | 280 | 8.0 | 35min | Y | ||
| 333 - 345 | LGR | 8.6 | 34.9 | 300 | 5.0 | 60min | Y | ||
| MW17-LGR | No DIGWSs attempted. | ||||||||
| MW12-LGR | 185 - 197 | LGR | 8.6 | 0 | 0 | n/a | 15min | N | 09/13/02 |
| 223 - 235 | LGR | 8.6 | 0 | 0 | n/a | 15min | N | ||
| 297 - 291 | LGR | 8.6 | 0 | 0 | n/a | 15min | N | ||
| 301 - 313 | LGR | 8.6 | 29.1 | 250 | 6.0 | 42min | Y | ||
| 322 - 334 | LGR | 8.6 | 14.0 | 120 | 5.0 | 23min | Y | ||
| 334 - 346 | LGR | 8.6 | 24.2 | 208 | 8.0 | 26min | Y | ||
| 346 - 358 | LGR | 8.6 | 23.8 | 205 | 8.2 | 25min | Y | ||
| MW12-BS | No DIGWSs attempted in the BS at this cluster. | ||||||||
| MW12-CC | 396 - 408 | CC | 8.6 | 0 | 0 | n/a | 15min | N | 09/26/02 |
| 416 - 428 | CC | 8.6 | 32.6 | 280 | 8.0 | 35 | Y | ||
| 430 - 442 | CC | 8.6 | 34.9 | 300 | 7.5 | 40 | Y | ||
| 445 - 457 | CC | 8.6 | 82.6 | 710 | 7.5 | 95 | Y | 09/27/02 | |
| 461 - 473 | CC | 8.6 | 69.8 | 600 | 7.5 | 80 | Y | ||
| MW1-BS | 328 - 382 | BS | 141 | 4.0 | 565 | 5.3 | 3hrs pumping intermittently | Y | 11/08/02 - 11/10/02 |
| MW1-CC | 383 - 395 | CC | 8.6 | 23.0 | 198 | 6.6 | 30min | Y | 12/19/02 |
| 400 - 412 | CC | 8.6 | 24.1 | 207 | 6.1 | 34min | Y | ||
| 420 - 432 | CC | 8.6 | 17.8 | 153 | 6.1 | 25min | Y | ||
| MW2-CC | 356.5 - 402 | BS | 32 | 4.3 | 137 | n/a | 3hr 30 min bailing intermittently | Y | 02/27/03 - 03/02/03 |
| 405 - 417 | CC | 8.6 | 14.0 | 120 | 6.0 | 25min | Y | 03/06/03 | |
| 421 - 433 | CC | 8.6 | 12.8 | 110 | 6.3 | 20min | Y | ||
| 443 - 455 | CC | 8.6 | 14.0 | 120 | 6.6 | 20min | Y | ||
| MW11A-LGR | 245 - 257 | LGR | 8.6 | 0 | 0 | n/a | 20min | N | 03/20/03 |
| 320 - 332 | LGR | 8.6 | 0 | 0 | n/a | 20min | N | ||
| 343 - 355 | LGR | 8.6 | <1 | 8 | n/a | 15min | N | 03/19/03 | |
| 395 - 407 | LGR | 8.6 | 44.7 | 384 | 6.4 | 60min | Y | ||
| 418 - 430 | LGR | 8.6 | 10.1 | 87 | 6.7 | 13min | Y | 03/31/03 | |
| 430 - 442 | LGR | 8.6 | 14.5 | 125 | 6.3 | 20min | Y | ||
| MW11B-LGR (8-in. diameter) | 80 - 140 | LGR | 156 | 2.8 | 432 | 4.7 | 92min | Y | 04/04/03 |
| 145 - 176 | LGR | 81 | 2.9 | 237 | <1 | 4hr 42min pumping intermittently | Y | 04/07/03 - 04/08/03 | |
| 179 - 213 | LGR | 89 | 6.4 | 570 | 15.0 | 38min | Y | 04/08/03 | |
| 217 - 260 | LGR | 112 | 5.4 | 600 | 14.5 | 43min | Y | 04/09/03 | |
| MW16-CC | 190 - 202 | LGR | 8.6 | 2.6 | 22 | <� | 86min | Y | 04/21/03 |
| 315 - 327 | LGR | 8.6 | 11.4 | 98 | 6.2 | 16min | Y | ||
| 398 - 410 | CC | 8.6 | 14.0 | 120 | 7.1 | 17min | Y | 06/04/03 | |
| 411 - 423 | CC | 8.6 | 19.8 | 170 | 6.1 | 28min | Y | ||
| WB01 | 132 - 144 | LGR | 8.6 | 0 | 0 | n/a | 25min | N | 06/12/03 |
| 167 - 179 | LGR | 8.6 | 0 | 0 | n/a | 25min | N | ||
| 204 - 216 | LGR | 8.6 | 0 | 0 | n/a | 25min | N | ||
| 237 - 249 | LGR | 8.6 | 15.5 | 133 | 7.4 | 18min | Y | ||
| 260 - 272 | LGR | 8.6 | 0.3 | 3 | <1 | 50min | N | 06/13/03 | |
| 272 - 284 | LGR | 8.6 | 0 | 0 | n/a | 20min | N | ||
| 297 - 309 | LGR | 8.6 | 5.8 | 50 | 0.9 | 53 | Y | ||
| WB02 | 126 - 138 | LGR | 8.6 | 2.3 | 20 | 0.5 | 60min pumping intermittently | Y | 06/20/03 |
| 234 - 246 | LGR | 8.6 | 0 | 0 | n/a | 25min | N | ||
| 260 - 272 | LGR | 8.6 | 0 | 0 | n/a | 25min | N | ||
| 297 - 309 | LGR | 8.6 | 18.0 | 155 | 5.0 | 31 | Y | 06/23/03 | |
| WB03 | 106.5-118.5 | LGR | 8.6 | 11.0 | 95 | 6.3 | 15min | Y | 06/30/03 |
| 117 - 129 | LGR | 8.6 | 5.8 | 50 | 1.2 | 41min | Y | ||
| 190 - 202 | LGR | 8.6 | 0.5 | 4 | <� | 30min pumping intermittently | N | ||
| 229 - 241 | LGR | 8.6 | 2.2 | 19 | 0.5 | 1hr 20min pumping intermittently | Y | ||
| 297.5-309.5 | LGR | 8.6 | 13.4 | 115 | 0.9 | 2hr 5min | Y | 07/01/03 | |
| WB04 | 175 - 255 | LGR | 57 | 3.0 | 170 | <1 | 11hr 50min pumping intermittently | Y | 7/23/03 - 7/24/03 |
| 242 - 254 | LGR | 8.6 | 0 | 0 | n/a | 30min pumping intermittently | N | 07/21/03 | |
| 327 - 339 | LGR | 8.6 | 30.8 | 265 | 7.1 | 38min | Y | ||
| 304 - 316 | LGR | 8.6 | 29.1 | 250 | 4.0 | 1hr 2min | Y | 07/22/03 | |
| 362 - 374 | LGR | 8.6 | 33.1 | 285 | 7.0 | 40min | Y | ||
| 458 - 470 | CC | 8.6 | 46.5 | 400 | 7.0 | 60min | Y | ||
| 476 - 488 | CC | 8.6 | 40.1 | 345 | 7.1 | 48min | Y | ||
| RFR-10 (7-in. diameter) | 134 - 198 | LGR | 128 | 0.7 | 92 | <1 | 6hr 15min pumping intermittently | Y | 7/17/03 - 07/18/03 |
| 201 - 265 | LGR | 128 | 3.6 | 456 | <1 | 11hr 35min pumping intermittently | Y | 07/15/03 - 07/16/03 | |
| 302 - 366 | LGR | 128 | 4.1 | 522 | 11.0 | 47 | Y | 07/12/03 | |
| 360 - 424 | LGR/BS | 128 | 4.3 | 550 | 11.0 | 50 | Y | ||
| 413 - 477 | BS/CC | 128 | 4.9 | 632 | 15.5 | 40 | Y | ||
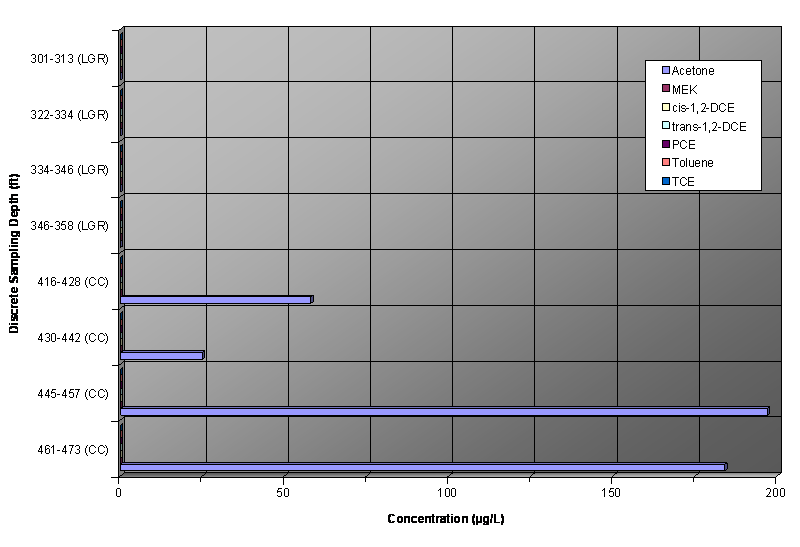
In the corehole at MW18-LGR, three DIGW samples were collected out of four attempts on July 24, 2002. The dual packer apparatus was assembled with a 12‑foot interval. The intervals were selected based primarily on apparent transmissivity as indicated by high resistivity and low gamma counts on the geophysical log. The top zone from 77 to 89 feet was chosen for testing of shallow groundwater downgradient of Plume 1 and because of a large cavity shown on the caliper log. The two deeper zones, 379‑391 feet and 401‑413 feet bgs were selected for their location in the major water-bearing zone of the LGR and also within the proposed screened portion of MW18-LGR. Pumping of the interval 239‑251 feet bgs resulted in a �no flow� condition, thus no sample was collected.
Laboratory results of the three MW18-LGR DIGW samples indicated minimal impact of CS-MW18-LGR groundwater (Table 4.3 and Figure 4.1). The contaminants detected during discrete interval sampling were acetone and toluene. Each contaminant was detected only once in different zones, and at very low concentrations. Acetone was identified at 29 micrograms per liter (�g/L) at 379-391 feet bgs, and toluene at 1.6 �g/L at 401‑413 feet bgs. As mentioned previously, these two compounds may not be associated with an established contaminant plume within CSSA, and may be remnants of the drilling process.
Table 4.3 - CS-MW18-LGR Discrete Interval Groundwater Sampling Results
| Depth | PCE | TCE | cis-1,2-DCE | trans-1,2-DCE | Toluene | MEK | Acetone |
| (feet bgs) | (μg/L) | ||||||
| 77-89 | <1 | <1 | <0.2 | <0.2 | <1 | <12 | <12 |
| 379-391 | <1 | <1 | <0.2 | <0.2 | <1 | <12 | 29 |
| 401-413 | <1 | <1 | <0.2 | <0.2 | 1.6 | <12 | <12 |
| MCL | 5 | 5 | 70 | 100 | 1,000 | 15,000 | 2,400 |
| "<" = Less than Method Detection Limit | |||||||
Figure 4.1 - CS-MW18-LGR Discrete Interval Groundwater Sampling Chart
At MW19, two deep DIGW samples were obtained after two unsuccessful attempts from shallower depths. The intervals were chosen for their water-producing potential as indicated on the logs. The first zone, 113‑125 feet bgs, had insufficient yield for sampling. During packer inflation at the next interval, one of the packers failed and required replacement. Sampling continued the following day, August 6, 2002. No sample was collected from the 195 to 207 foot interval because of extremely low flow conditions. Sample collection was successful deeper in the LGR at 312‑324 feet and 333‑345 feet bgs.
Low concentrations of toluene were detected in all three of the MW19-LGR discrete samples (Table 4.4 and Figure 4.2). The intervals 312-324 feet, 333-345 feet, and 353‑365 feet bgs show concentrations of 3.8 �g/L, 32.6 �g/L, and 7.95 �g/L, respectively. No other parameters were detected.
Table 4.4 - CS-MW19-LGR Discrete Interval Groundwater Sampling Results
| Depth | PCE | TCE | cis-1,2-DCE | trans-1,2-DCE | Toluene | MEK | Acetone |
| (feet bgs) | (μg/L) | ||||||
| 312-324 | <1 | <1 | <0.2 | <0.2 | 3.8 | <12 | <12 |
| 333-345 | <1 | <1 | <0.2 | <0.2 | 32.6 | <12 | <12 |
| 353-365 | <1 | <1 | <0.2 | <0.2 | 7.95 | <12 | <12 |
| MCL | 5 | 5 | 70 | 100 | 1,000 | 15,000 | 2,400 |
| "<" = Less than Method Detection Limit | |||||||
Figure 4.2 - CS-MW19-LGR Discrete Interval Groundwater Sampling Chart
Discrete interval groundwater sampling was not conducted at this well.
Sampling attempts at the intervals of 185‑197 feet, 223‑235 feet, and 297‑291 feet bgs resulted only in identifying very low yielding portions of the formation. The logs showed elevated resistivity at these points indicating possible transmissive areas. Groundwater samples from CS‑MW12-LGR were obtained from deeper intervals of 301‑313 feet, 322‑334 feet, 334‑346 feet, and 346‑358 feet bgs. These zones were selected for their permeable and porous characteristics, and to examine the potential screened portion of the well. The CS‑MW12-LGR DIGW sampling event occurred on September 13, 2002. The chemical analyses results of CS‑MW12-LGR DIGW samples show no VOC detections in the intervals sampled (Table 4.5 and Figure 4.3).
Table 4.5 - CS-MW12-LGR Discrete Interval Groundwater Sampling Results
| Depth | PCE | TCE | cis-1,2-DCE | trans-1,2-DCE | Toluene | MEK | Acetone |
| (feet bgs) | (μg/L) | ||||||
| 301-313 | <1 | <1 | <0.2 | <0.2 | <1 | <12 | <12 |
| 322-334 | <1 | <1 | <0.2 | <0.2 | <1 | <12 | <12 |
| 334-346 | <1 | <1 | <0.2 | <0.2 | <1 | <12 | <12 |
| 346-358 | <1 | <1 | <0.2 | <0.2 | <1 | <12 | <12 |
| MCL | 5 | 5 | 70 | 100 | 1,000 | 15,000 | 2,400 |
| "<" = Less than Method Detection Limit | |||||||
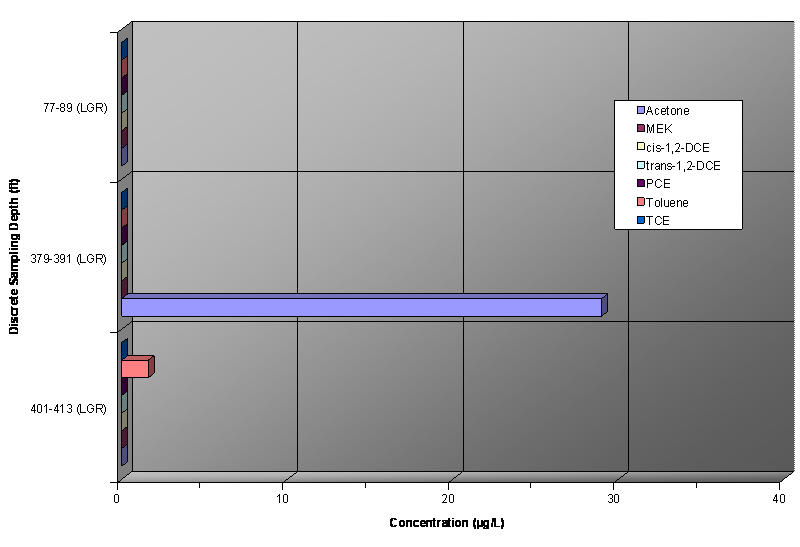
Figure 4.3 - CS-MW12-LGR and �CC Discrete Interval Groundwater Sampling Chart
Discrete interval groundwater sampling was not conducted in this well or in the BS at the other CS‑MW12 cluster wells.
Intervals for CS‑MW12-CC were picked to test zones for potential well screen placement. Selection relied mostly on high resistivity and low gamma readings on the logs. The packer apparatus remained set with a 12‑foot open interval. All intervals except one (396‑408 feet bgs) produced good groundwater flow. Samples were collected from 416‑428 feet, 430‑442 feet, 445‑457 feet, and 461‑473 feet bgs. Groundwater sample collection at CS‑MW12-CC took place September 26‑27, 2002.
Acetone was detected in all four CS‑MW12-CC DIGW samples (Table 4.6 and Figure 4.3). Concentrations ranged from 25 �g/L in the 430‑457 foot interval to 197 �g/L in the 445‑457 foot interval. No other VOCs were detected in the CS‑MW12-CC discrete samples. The presence of acetone is suspected to be related to the use of foam surfactant for cuttings removal during the drilling process.
Table 4.6 - CS-MW12-CC Discrete Interval Groundwater Sampling Results
| Depth | PCE | TCE | cis-1,2-DCE | trans-1,2-DCE | Toluene | MEK | Acetone |
| (feet bgs) | (μg/L) | ||||||
| 416-428 CC | <1 | <1 | <0.2 | <0.2 | <1 | <12 | 58 |
| 430-442 CC | <1 | <1 | <0.2 | <0.2 | <1 | <12 | 25 |
| 445-457 CC | <1 | <1 | <0.2 | <0.2 | <1 | <12 | 197 |
| 461-473 CC | <1 | <1 | <0.2 | <0.2 | <1 | <12 | 184 |
| MCL | 5 | 5 | 70 | 100 | 1,000 | 15,000 | 2,400 |
| "<" = Less than Method Detection Limit | |||||||
The BS would not normally be subjected to sampling under TO42; however, the LGR was known to be contaminated at this location and vertical delineation had not yet been established. Subsequently, one groundwater sample was collected from the CS‑MW1-BS corehole after casing had been installed through the overlying LGR. The BS was exposed through most of its depth, from 328 to 380 feet. The hole extended 2 feet into the top of the CC, to 382 feet. A pump was set at 375 feet bgs, 6.5 feet above the bottom of the open, 4.25‑inch diameter corehole. The well section was evacuated twice (down to pump intake level) on November 8, 2002 and then allowed to recover. Yield was low and recovery was slow, as would be expected from the BS. Parsons returned on November 10, 2002 to conduct further purging and to sample. A water sample was obtained via submersible pump after approximately four interval volumes had been intermittently pumped out.
Laboratory results (Table 4.7 and Figure 4.4) show low concentrations of cis-1,2-DCE, PCE, TCE, and toluene in the CS‑MW1‑BS groundwater at 3.22 �g/L, 1.3 �g/L, 1.2 �g/L, and 40.4 �g/L, respectively. Acetone was also identified at 107 �g/L. This information led to the decision to complete the CS‑MW1-CC well as a triple-cased well to protect the CC from downward migration of contaminants.
Table 4.7 - CS-MW1-BS Discrete Interval Groundwater Sampling Results
Depth | PCE | TCE | cis-1,2-DCE | trans-1,2-DCE | Toluene | MEK | Acetone |
| (feet bgs) | (μg/L) | ||||||
| 328-382 | 1.3 | 1.2 | 3.22 | <0.2 | 40.4 | <12 | 107 |
| MCL | 5 | 5 | 70 | 100 | 1,000 | 15,000 | 2,400 |
| "<" = Less than Method Detection Limit | |||||||
Figure 4.4 - CS-MW1-BS and -CC Discrete Interval Groundwater Sampling Chart
On December 19, 2002 three DIGW samples were collected from the CS‑MW1-CC corehole. Samples from 383‑395 feet, 400‑412 feet, and 420‑432 feet bgs were easily obtained from the fossiliferous, porous limestone of the middle CC. Flow data from the sample collection process also helped in determining the optimum position for the well�s screened interval.
The three DIGW samples taken from the CC at MW1 showed no detections of short-listed VOCs (Table 4.8 and Figure 4.4). This would suggest that in this area, contamination in the overlying LGR and BS has not migrated into the CC.
Table 4.8 - CS-MW1-CC Discrete Interval Groundwater Sampling Results
| Depth | PCE | TCE | cis-1,2-DCE | trans-1,2-DCE | Toluene | MEK | Acetone |
| (feet bgs) | (μg/L) | ||||||
| 383-395 | <1 | <1 | <0.2 | <0.2 | <1 | <12 | <12 |
| 400-412 | <1 | <1 | <0.2 | <0.2 | <1 | <12 | <12 |
| 420-432 | <1 | <1 | <0.2 | <0.2 | <1 | <12 | <12 |
| MCL | 5 | 5 | 70 | 100 | 1,000 | 15,000 | 2,400 |
| "<" = Less than Method Detection Limit | |||||||
No samples were taken from the LGR portion. That formation is currently monitored at this location through existing MW2-LGR. One groundwater sample was collected from the BS portion of the well. First the LGR portion of the hole was reamed and cased to 356.5 feet. Then the BS was cored to 402 feet. After surging the corehole, it was bailed dry once on February 27, 2003, and again the next day. On March 2 a sample was obtained by bailer from the open BS corehole interval, at 356.5‑402 feet bgs. Following this testing, the well was cored through the CC to a total depth of 492 feet. Three 12-foot intervals from the CC were selected during examination of the geophysical logs. Samples were taken on March 6 from relatively transmissive zones straddling the main water-bearing section of the CC at 405‑417 feet, 421‑433 feet, and 443‑55 feet bgs.
Table 4.9 and Figure 4.5 show the MW2‑CC DIGW sample results. The BS interval sample, 357‑402 feet bgs, contained acetone at 3,601 �g/L, and toluene at 1.9 �g/L, with no other VOCs. The CC DIGW samples results showed no detections of the short-listed VOC parameters.
Table 4.9 - CS-MW2-BS and -CC Discrete Interval Groundwater Sampling Results
| Depth | PCE | TCE | cis-1,2-DCE | trans-1,2-DCE | Toluene | MEK | Acetone |
| (feet bgs) | (μg/L) | ||||||
| 357-402 | <1 | <1 | <0.2 | <0.2 | 1.9 | <12 | 3,610 |
| 405-417 | <1 | <1 | <0.2 | <0.2 | <1 | <12 | <12 |
| 421-433 | <1 | <1 | <0.2 | <0.2 | <1 | <12 | <12 |
| 443-455 | <1 | <1 | <0.2 | <0.2 | <1 | <12 | <12 |
| MCL | 5 | 5 | 70 | 100 | 1,000 | 15,000 | 2,400 |
| "<" = Less than Method Detection Limit | |||||||
Figure 4.5 - CS-MW2-BS and -CC Discrete Interval Groundwater Sampling Chart
Out of six sampling attempts at this well, three were successful. The shallow interval 245‑257 feet bgs was chosen to straddle a large water-filled void recorded on the caliper log. Intervals at 320‑332 feet, and 343-355 feet bgs showed good resistivity on the logs, but unexpectedly did not yield water in quantities sufficient for DIGW sample collection. The 320‑332 foot zone covers a signature zone that exhibits a �scissor-tail� resistivity pattern recognizable in almost all CSSA LGR well logs, and while found to be a very low-flow zone here, it is a moderate to good producer at other locations. The highly resistive deeper zones provided adequate flow for sampling and information pertinent to screen depth selection. Groundwater samples at CS‑MW11A-LGR were obtained from 395‑407 feet, 418‑430 feet, and 430‑442 feet bgs.
The CS‑MW11A-LGR well produced larger than usual amounts of water during reaming to 8 inches. This prompted interest in the reef-like transmissive portions of the upper LGR at this location. Parsons constructed a second well at the site to be used for monitoring shallow LGR groundwater above the CS‑MW11A-LGR screened zone.
As shown in Table 4.10 and Figure 4.6, there were no VOCs detected above the method detection limit (MDL) in the CS‑MW11A-LGR discrete samples except toluene in the deeper 418‑430 foot and 430‑442 foot intervals, showing 1.9 and 3.88 �g/L, respectively.
Table 4.10 - CS-MW11A-LGR Discrete Interval Groundwater Sampling Results
| Depth | PCE | TCE | cis-1,2-DCE | trans-1,2-DCE | Toluene | MEK | Acetone |
| (feet bgs) | (μg/L) | ||||||
| 395-407 | <1 | <1 | <0.2 | <0.2 | <1 | <12 | <12 |
| 418-430 | <1 | <1 | <0.2 | <0.2 | 1.9 | <12 | <12 |
| 430-442 | <1 | <1 | <0.2 | <0.2 | 3.88 | <12 | <12 |
| MCL | 5 | 5 | 70 | 100 | 1,000 | 15,000 | 2,400 |
| "<" = Less than Method Detection Limit | |||||||
Figure 4.6 - CS-MW11A-LGR and �MW11B-LGR Discrete Interval Groundwater Sampling Chart
This well was drilled with an 8-inch diameter bit without initial coring. Sampling intervals were selected based on the geophysical logs from adjacent CS‑MW11A‑LGR. Sampling took place as the well was drilled from the shallow to the deeper zones. Contributing zones throughout the entire borehole were all exposed to sampling at one point or another in this manner. A larger single packer and pump apparatus was employed to gather DIGW samples from the borehole. To sample a zone in CS‑MW11B‑LGR, the borehole was advanced to the depth of the bottom of an interval. Bottom depths were terminated in very low to nontransmissive, nonporous layers. These layers separated the transmissive zones and served as solid sections of the borehole wall where the 3‑foot long packer could be effectively anchored. The drillers cleaned out the hole by surging, and then the drill string was tripped out. The packer assembly was emplaced with the packer inflated to seal the top of the interval. The bottom of the hole served as a lower seal. The interval was then purged and sampled in the usual way.
The topmost interval captured the first water-bearing zones encountered at the CS‑MW11 site. The interval also covered several voids shown on the CS‑MW11A-LGR caliper log between 110 and 140 feet. After the hole was drilled to 140 feet bgs, this interval was purged and sampled without inflating the packer since there was no need for isolation from any overlying zone. The remaining intervals were sampled using the packer to close off upper, previously sampled intervals. Other intervals sampled were 145‑176 feet, 179‑213 feet, and 217‑260 feet bgs.
Laboratory results (Table 4.11 and Figure 4.6) of the CS‑MW11B‑LGR DIGW samples contain no detections of short-list VOCs except for one toluene detection of 298 �g/L, from the 145‑176 foot interval.
Table 4.11 - CS-MW11B-LGR Discrete Interval Groundwater Sampling Results
| Depth | PCE | TCE | cis-1,2-DCE | trans-1,2-DCE | Toluene | MEK | Acetone |
| (feet bgs) | (μg/L) | ||||||
| 0-140 | <1 | <1 | <0.2 | <0.2 | <1 | <12 | <12 |
| 145-176 | <1 | <1 | <0.2 | <0.2 | 298 | <12 | <12 |
| 179-213 | <1 | <1 | <0.2 | <0.2 | <1 | <12 | <12 |
| 217-260 | <1 | <1 | <0.2 | <0.2 | <1 | <12 | <12 |
| MCL | 5 | 5 | 70 | 100 | 1,000 | 15,000 | 2,400 |
| "<" = Less than Method Detection Limit | |||||||
There were four DIGW samples collected during construction of CS‑MW16-CC. The LGR and CC were each sampled at two points. The existing CS‑MW16-LGR was not subjected to discrete interval sampling during earlier upgrading, consequently no LGR DIGW samples had yet been gathered from this location. In the middle LGR a moderately low gamma and moderately resistive interval was sampled 190‑202 feet bgs. A DIGW sample was collected from the bottom of the main water-bearing zone of the lower LGR at 315‑327 feet bgs. This interval corresponds to a portion of the LGR in CS‑MW16-LGR sealed by backplugging. The purpose of this discrete sample was to check contamination concentrations in the lower LGR after influence from the upper contaminated zones had been removed. The LGR DIGW samples were collected on April 21, 2003. The LGR section of the well was reamed and cased after sampling, before coring into the CC proceeded. The intervals sampled in the CC, 398‑410 feet and 411‑423 feet bgs, correspond to the formation�s major low gamma, high resistivity water-bearing zone, and the proposed location of the well screen. The CC DIGW samples were collected on June 4, 2003.
Groundwater samples collected from the CS‑MW16‑CC well exhibit contamination at all depths (Table 4.12 and Figure 4.7). Concentrations of PCE range from 8.58 �g/L at 398‑410 feet, to 48.4 �g/L at 411‑423 feet. The levels of TCE increase with depth from 22.1 �g/L to 131 �g/L, from intervals 109-202 feet to 411-423 feet bgs, respectively. The breakdown products cis-1,2-DCE and trans-1,2-DCE also exhibit trends of increasing concentration with depth; cis-1,2-DCE ranging from 23 �g/L to 139 �g/L, and trans-1,2-DCE from 0.7 �g/L to 3.51 �g/L. Toluene was found in the two samples pulled from the LGR portion of the well. The uppermost interval, 190‑202 feet bgs, shows 12.3 �g/L, and 1.4 �g/L is shown from the 315‑327 foot interval. No toluene was found above the MDL in the CC samples. Acetone was detected at 13 �g/L in one sample in the upper LGR at 190‑202 feet bgs.
Table 4.12 - CS-MW16-CC Discrete Interval Groundwater Sampling Results
| Depth | PCE | TCE | cis-1,2-DCE | trans-1,2-DCE | Toluene | MEK | Acetone |
| (feet bgs) | (μg/L) | ||||||
| 190-202 | 19.5 | 22.1 | 23 | 0.7 | 12.3 | <12 | 13 |
| 315-327 | 44.3 | 47.1 | 46.3 | 0.29 | 1.4 | <12 | <12 |
| 398-410 | 8.58 | 95 | 135 | 1.86 | <1 | <12 | <12 |
| 411-423 | 48.4 | 131 | 139 | 3.51 | <1 | <12 | <12 |
| MCL | 5 | 5 | 70 | 100 | 1,000 | 15,000 | 2,400 |
| "<" = Less than Method Detection Limit | |||||||
Figure 4.7 - CS-MW16-CC Discrete Interval Groundwater Sampling Chart

A total of seven efforts were made to collect DIGW samples from CS‑WB01, with two succeeding. All intervals were selected for the moderate to low gamma and high resistivity shown on the geophysical logs. The intervals successfully sampled, 237‑249 feet and 297‑309 feet bgs, also contained cavities according to the caliper log. The 237‑249 foot interval exhibited good groundwater flow while the 297‑309 foot interval yielded an average 0.9 gpm.
Intervals with inadequate flow were 132‑144, 167‑179, 204‑216, 260‑272, and 272‑284 feet bgs. Sampling occurred June 12 to 13, 2003.
As given in Table 4.13 and Figure 4.8, the 237‑249 foot interval sample results show two VOC detections, PCE at 15.1 �g/L, and TCE at 16.6 �g/L. Within the interval at the bottom of the hole, low concentrations of cis-1,2-DCE (0.58 �g/L) were found as well as 10 �g/L PCE and 21 �g/L TCE.
Table 4.13 - CS-WB01 Discrete Interval Groundwater Sampling Results
| Depth | PCE | TCE | cis-1,2-DCE | trans-1,2-DCE | Toluene | MEK | Acetone |
| (feet bgs) | (μg/L) | ||||||
| 237-249 | 15.1 | 16.6 | <0.2 | <0.2 | <1 | <12 | <12 |
| 297-309 | 10 | 21 | 0.58 | <0.2 | 1.9 | <12 | <12 |
| MCL | 5 | 5 | 70 | 100 | 1,000 | 15,000 | 2,400 |
| "<" = Less than Method Detection Limit | |||||||
Figure 4.8 - CS-WB01 Discrete Interval Groundwater Sampling Chart

After coring at CS‑WB02 was completed, two DIGW samples were collected. The interval 126-138 feet bgs was pumped intermittently at approximately 0.5 gpm for an hour, allowing for recovery periods. Efforts made to sample two intervals below this perched water zone, 234‑246 feet and 260‑272 feet bgs, failed due to flow conditions insufficient for sample collection. The 234‑246 foot zone in WB02 is geologically correlative to a zone in CS‑WB01 that produced good flow. The interval 297‑309 feet bgs near the bottom of the corehole encompassed a minor water-bearing zone. The interval was purged at 5 gpm for about half an hour and successfully sampled. Sampling occurred on June 20 and 23, 2003.
In the upper interval (126‑138 feet bgs) PCE was detected at 4.89 �g/L and toluene at 2.4 �g/L (Table 4.14 and Figure 4.9). The bottom interval sample at 297‑309 feet bgs shows PCE at 9.57 �g/L, TCE at 2.92 �g/L, and very low toluene at 2.32 �g/L.
Table 4.14 - CS-WB02 Discrete Interval Groundwater Sampling Results
| Depth | PCE | TCE | cis-1,2-DCE | trans-1,2-DCE | Toluene | MEK | Acetone |
| (feet bgs) | (μg/L) | ||||||
| 126-138 | 4.89 | <0.1 | <0.2 | <0.7 | 2.4 | <5 | <5 |
| 297-309 | 9.57 | 2.92 | <0.2 | <0.7 | 2.32 | <5 | <5 |
| MCL | 5 | 5 | 70 | 100 | 1,000 | 15,000 | 2,400 |
| "<" = Less than Method Detection Limit | |||||||
Figure 4.9 - CS-WB02 Discrete Interval Groundwater Sampling Chart
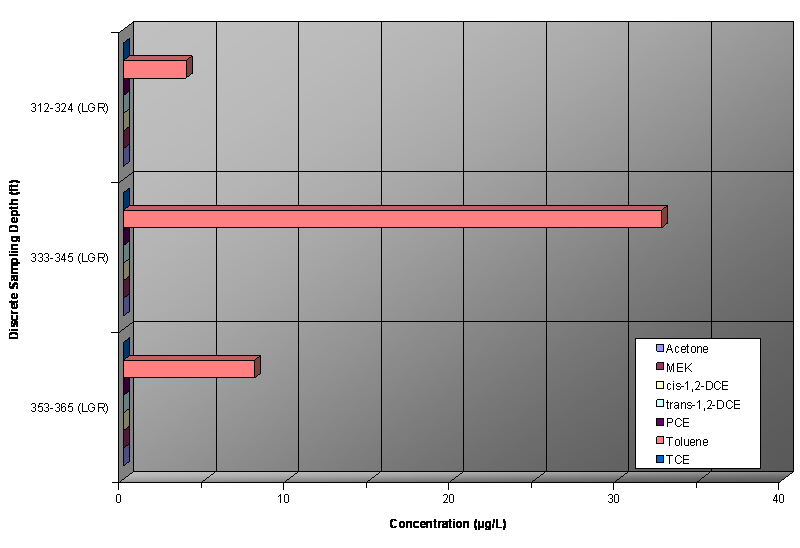
Discrete interval sampling at CS‑WB03 resulted in five DIGW samples collected out of five attempts. The best flow was obtained from the two uppermost intervals, 106.5‑118.5 feet and 117‑129 feet bgs. These intervals were placed in a bioherm zone of very low gamma and high resistivity. The remaining intervals, 190‑202 feet, 229‑241 feet, and 297.5‑309.5 feet bgs, were selected also for resistivity spikes on the electric log, and openings in the formation as shown on the caliper log. These three zones exhibited reduced yield in contrast to the two shallower intervals sampled.
The CS‑WB03 discrete results generally show high concentrations of PCE, moderate TCE and toluene levels, and very low cis-1,2-DCE concentrations (Table 4.15 and Figure 4.10). There is a short PCE trend increasing with depth from the shallow LGR intervals to 229-241 feet, from 32.1 to 767 �g/L. In the bottom interval, 298‑310 feet, the PCE concentration decreases to 380 �g/L. Toluene concentrations trend the same as PCE, from 1.8 �g/L in the top zone to 197 �g/L in the 229‑241 foot interval, and are lower at 122 �g/L in the bottom 298‑310 foot interval. The TCE levels also increase with depth through the top three intervals, ranging from 3.36 to 21.3 �g/L, and then show a decline to 8.37 �g/L in the bottom interval.
Table 4.15 - CS-WB03 Discrete Interval Groundwater Sampling Results
| Depth | PCE | TCE | cis-1,2-DCE | trans-1,2-DCE | Toluene | MEK | Acetone |
| (feet bgs) | (μg/L) | ||||||
| 107-119 | 32.1 | 3.36 | <0.2 | <0.7 | 1.8 | <5 | <5 |
| 117-129 | 109 | 14.4 | 0.47 | <0.7 | 15.3 | <5 | <5 |
| 229-241 | 767 | 21.3 | 0.69 | <0.7 | 197 | <5 | <5 |
| 298-310 | 380 | 8.37 | 0.25 | <0.7 | 122 | <5 | <5 |
| MCL | 5 | 5 | 70 | 100 | 1,000 | 15,000 | 2,400 |
| "<" = Less than Method Detection Limit | |||||||
Figure 4.10 - CS-WB03 Discrete Interval Groundwater Sampling Chart
This well is a private domestic supply well located off-post. The pump was temporarily removed for system modifications, providing a good opportunity to conduct interval sampling off-post. The well diameter was basically 6.5 to 7 inches with frequent voids, washout cavities, ledges, and generally uneven walls. Well diameter and poor integrity of the well walls necessitated a 64‑foot interval with a borehole volume of about 128 gallons. This was needed so the packers could be inflated against smooth and firm wall surfaces, thus ensuring good seals and avoiding packer damage or wall collapse. The large diameter dual packer apparatus used at CS‑MW11B was also used at RFR‑10.
Purging and sampling at RFR-10 continued from July 12 to July 18, 2003. The well was sampled from bottom to top, and all five attempts were successful. For the deepest setting, the bottom packer was placed at the bottom of the well, making an interval from 413‑477 feet, including the bottom of the BS and the top half of the CC. The next interval was set 360‑424 feet and covered the bottom 15 feet of the LGR and most of the BS. This spacing also encompassed a large void between 379 and 385 feet.
The next interval was placed 302‑366 feet and included the majority of the main water-bearing zone in the lower LGR, as well as several voids. The two more shallow intervals, 201‑265 feet and 134‑198 feet bgs, each required 2 days of intermittent pumping for adequate purging.
Detections of VOCs in the large RFR-10 interval samples included cis-1,2-DCE, PCE, TCE, and toluene (Table 4.16 and Figure 4.11). Generally, contaminant concentrations were greater in the shallower LGR portions of the well than in the lower BS and CC sections. PCE and toluene were found in all the samples, which indicates contamination along the entire well depth, from 91.7 �g/L in the uppermost interval, to 4.86 �g/L in the 360‑424 foot interval. The bottom section, 413‑477 feet, shows a slight PCE increase to 9.02 �g/L. Toluene concentrations are low in the RFR-10 intervals ranging from 2.04 �g/L in the top interval to 27.5 �g/L in the 210‑265 foot LGR interval. The LGR and upper BS interval samples, 302‑366 feet and 360‑424 feet bgs, contained no TCE above MDL. The very low cis-1,2‑DCE concentrations reported by the laboratory follow the same pattern as those of the TCE. No cis-1,2-DCE was found in the lower LGR and upper BS intervals. The bottom interval, 413‑477 feet, showed 0.37 �g/L cis‑1,2-DCE, while the top two intervals, 134‑198 feet and 201‑265 feet bgs, show 0.56 �g/L and 0.79 �g/L, respectively. According to the laboratory reports, acetone, MEK, and trans‑1,2‑DCE were not detected in any RFR-10 DIGW samples.
Table 4.16 - RFR-10 Discrete Interval Groundwater Sampling Results
| Depth | PCE | TCE | cis-1,2-DCE | trans-1,2-DCE | Toluene | MEK | Acetone |
| (feet bgs) | (μg/L) | ||||||
| 134-198 | 91.7 | 16.2 | 0.56 | <0.7 | 2.04 | <5 | <5 |
| 201-265 | 54.4 | 19.9 | 0.79 | <0.7 | 27.5 | <5 | <5 |
| 302-366 | 5.07 | <0.1 | <0.2 | <0.7 | 19.9 | <5 | <5 |
| 360-424 | 4.86 | <0.1 | <0.2 | <0.7 | 22.6 | <5 | <5 |
| 413-477 | 9.02 | 1.29 | 0.37 | <0.7 | 7.34 | <5 | <5 |
| MCL | 5 | 5 | 70 | 100 | 1,000 | 15,000 | 2,400 |
| "<" = Less than Method Detection Limit | |||||||
Figure 4.11 - RFR-10 Discrete Interval Groundwater Sampling Chart
In contrast to the other WB coreholes, DIGW samples were based chiefly upon the results of hydrophysical testing rather than geophysical logging. The order in which events occurred allowed for the opportunity to test the results of the HpL. The zones sampled were mostly selected based on the potential estimate for flow provided by COLOG. Out of seven intervals chosen in CS-WB04, only one could not be sampled. The interval 242‑254 feet bgs was unable to be sampled because of extremely low flow. This zone corresponds to the higher-yielding 237‑249 foot zone (7.4 gpm) in WB01. Intervals selected below this depth readily produced water for sampling. Zones 304‑316, 327‑339, and 362‑374 feet bgs are in the LGR, and zones 458-470 and 476-488 feet bgs are in the middle of the CC. Sampling of the above mentioned DIGW samples occurred July 21‑22, 2003.
Chemical analysis results for the RFR-10 samples were received while DIGW sample collection was proceeding at CS‑WB04. The RFR-10 results indicated contamination in the upper layers of the LGR. It was decided to try sampling the corresponding LGR section at CS‑WB04. However, it was determined after review of the geologic, geophysical, and hydrophysical logs, and by previous sampling experience in this zone that no single 12-foot interval would have provided sufficient groundwater for a valid sample. To successfully sample in the upper 250 feet of LGR at CS‑WB04, a modified packer assembly was employed. GPI reconfigured the compressed nitrogen feed line, bypassing the top packer so only the bottom packer on the assembly would inflate. The single packer assembly was set so the CS‑WB04 corehole was open to 255 feet, overlapping the 242‑254 foot low-flow zone where earlier sampling failed. At that time this extended zone consisted of numerous, low-flow, seeping zones and seams, all contributing to a water column of approximately 80 feet above the packer. The extended interval was pumped out and naturally recharged several times from July 23 to 24, 2003. A sample was collected in the usual manner on July 24, 2003 after an approximate total of three volumes were purged.
Generally, VOC concentrations detected in CS‑WB04 mirror the pattern of nearby RFR‑10 results, because there were greater concentrations found in the upper LGR intervals and lesser concentrations in the deeper intervals, albeit with much lower concentrations overall (Table 4.17 and Figure 4.12). The top two interval samples, 0‑255 and 304‑316 feet bgs, had PCE levels of 6.1 and 7.9 �g/L, respectively. The deepest two zones, 458‑470 feet and 476‑488 feet bgs, had PCE levels of 1.7 and 1 �g/L, respectively. The intervals in the main water-bearing zone of the lower LGR, 327‑339 and 362‑374 feet, show no PCE detections. These two zones also had the smallest TCE concentrations in RFR‑10 of 0.84 and 0.23 �g/L. The interval with the greatest PCE level, 304‑316 feet in the LGR, also shows the highest TCE level of 9.13 �g/L. In the remaining three intervals, TCE ranges from 1.12 (476‑488 feet) to 1.94 �g/L (0‑255 feet). Two samples out of the total six, 304‑316 feet in the LGR and 476‑488 feet in the lower CC, show cis‑1,2‑DCE detections of 0.24 and 0.25 �g/L, respectively. Toluene is reported sporadically, ranging from not detected above MDL (304‑316 and 327‑339 feet) to 15.7 �g/L in the 0‑255 feet interval. According to the laboratory reports, acetone, MEK, and trans‑1,2‑DCE were not detected in any CS‑WB04 DIGW samples.
Table 4.17 - CS-WB04 Discrete Interval Groundwater Sampling Results
| Depth | PCE | TCE | cis-1,2-DCE | trans-1,2-DCE | Toluene | MEK | Acetone |
| (feet bgs) | (μg/L) | ||||||
| 0-255 | 6.1 | 1.94 | <0.2 | <0.7 | 15.7 | <5 | <5 |
| 304-316 | 7.9 | 9.13 | 0.24 | <0.7 | <0.7 | <5 | <5 |
| 327-339 | <0.7 | 0.84 | <0.2 | <0.7 | <0.7 | <5 | <5 |
| 362-374 | <0.7 | 0.23 | <0.2 | <0.7 | 2.43 | <5 | <5 |
| 458-470 | 1.7 | 1.69 | <0.2 | <0.7 | 12.3 | <5 | <5 |
| 476-488 | 1 | 1.12 | 0.25 | <0.7 | 7.16 | <5 | <5 |
| MCL | 5 | 5 | 70 | 100 | 1,000 | 15,000 | 2,400 |
| "<" = Less than Method Detection Limit | |||||||
Figure 4.12 - CS-WB04 Discrete Interval Groundwater Sampling Chart
The single TO42 rock sample was taken from corehole CS‑WB01 from a depth of 14 feet bgs. The sample was collected during coring after PID screening indicated possible high VOC concentrations. The core sample was submitted to Severn-Trent Laboratories for VOC analysis (Method SW-8260B). Very low concentrations of 1,2,3‑trichlorobenzene (1,2,3-TCB), 1,2,4‑trichlorobenzene (1,2,4‑TCB), naphthalene, and PCE were reported (Table 4.18). Data shows no extreme VOC contamination at that depth in that location. All detections were below the reporting limit (RL) (�F� flagged).
Table 4.18 - CS-WB01 Soil/Rock Sampling Results
| Depth | PCE | Naphthalene | 1,2,3-TCB | 1,2,4-TCB |
| (feet bgs) | (mg/kg) | |||
| 14-14.5 | 0.00023 F | 0.00064 F | 0.00037 F | 0.00041 F |
| "<" = Less than Method Detection Limit | ||||
Processing and interpretation of the geophysical and HpL for CS‑WB01 suggest the presence of nine water-producing intervals for this corehole. The results of these analyses are presented in Table 4.19. Most of these producing intervals correlate well with water-bearing zones identified during ambient testing (Figure 4.13). The interval 239.0‑242.5 feet bgs dominated inflow during the pumping test, producing 0.309 gpm, or 42 percent of the total flow during testing (Figure 4.14). This was the only zone to produce good flow for DIGW sampling.
Table 4.19 - Summary of Hydrophysical Logging Results
| Well ID | Water-Bearing Interval # | Interval of Flow | Interval Specific Flow Rate | Interval Specific Flow Rate | Interval Specific | Transmissivity |
| CS-WB01 | 1 | 169.2 - 169.5 | 0.000 | 0.008 | 0.761 | 0.228 |
| 2 | 170.0 - 170.8 | 0.004 | 0.013 | 0.321 | 0.257 | |
| 3 | 209.4 - 211.9 | 0.003 | 0.005 | 0.028 | 0.057 | |
| 4 | 218.8 - 221.4 | 0.000 | 0.013 | 0.143 | 0.371 | |
| 5 | 233.8 - 235.9 | -0.034 | 0.264 | 4.05 | 8.50 | |
| 6 | 239.0 - 242.5 | 0.000 | 0.309 | 2.52 | 8.81 | |
| 7 | 271.5 - 272.9 | 0.000 | 0.034 | 0.693 | 0.970 | |
| 8 | 295.6 - 296.4 | 0.000 | 0.013 | 0.464 | 0.371 | |
| 9 | 305.5 - 308.1 | -0.017 | 0.053 | 0.768 | 2.00 | |
| CS-WB02 | 1 | 301.4 - 303.8 | -0.501 | 0.909 | 15.8 | 37.8 |
| CS-WB03 | 1 | 106.2 - 109.6 | 0.053 | NA | NA | NA |
| 2 | 112.0 - 112.8 | 0.437 | NA | NA | NA | |
| 3 | 133.5 - 137.5 | 0.053 | 0.076 | 0.063 | 0.233 | |
| 4 | 145.9 - 146.5 | 0.000 | 0.079 | 1.33 | 0.799 | |
| 5 | 152.6 - 153.9 | 0.000 | 0.053 | 0.413 | 0.536 | |
| 6 | 157.4 - 191.6 | 0.000 | 0.264 | 0.078 | 2.67 | |
| 7 | 196.6 - 198.0 | 0.000 | 0.062 | 0.448 | 0.627 | |
| 8 | 204.4 - 207.0 | 0.000 | 0.033 | 0.128 | 0.334 | |
| 9 | 209.2 - 210.0 | 0.000 | 0.031 | 0.392 | 0.314 | |
| 10 | 212.7 - 214.7 | 0.000 | 0.044 | 0.223 | 0.445 | |
| 11 | 220.3 - 221.6 | 0.000 | 0.049 | 0.381 | 0.496 | |
| 12 | 230.9 - 231.4 | 0.000 | 0.022 | 0.445 | 0.223 | |
| 13 | 234.2 - 234.8 | 0.000 | 0.036 | 0.607 | 0.364 | |
| 14 | 239.0 - 239.7 | 0.000 | 0.047 | 0.679 | 0.476 | |
| 15 | 243.0 - 306.0 | -0.560 | 0.335 | 0.144 | 9.06 | |
| CS-WB04 | 1 | 177.6 - 179.5 | 0.024 | NA | NA | NA |
| 2 | 208.2 - 210.8 | 0.030 | 0.033 | 0.019 | 0.048 | |
| 3 | 218.3 - 219.6 | 0.000 | 0.068 | 0.842 | 1.09 | |
| 4 | 227.9 - 229.0 | 0.009 | 0.198 | 2.77 | 3.04 | |
| 5 | 253.6 - 254.3 | 0.039 | 0.175 | 3.82 | 2.67 | |
| 6 | 309.2 - 310.7 | 0.074 | 0.313 | 2.57 | 3.85 | |
| 7 | 332.2 - 335.3 | 0.238 | 2.73 | 12.9 | 40.0 | |
| 8 | 360.0 - 362.6 | 0.005 | 1.00 | 6.16 | 16.0 | |
| 9 | 370.5 - 371.8 | 0.018 | 0.721 | 8.71 | 11.3 | |
| 10 | 375.6 - 376.7 | 0.159 | 0.165 | 0.088 | 0.097 | |
| 11 | 464.2 - 466.9 | -0.597 | 0.264 | 5.13 | 13.9 | |
| 12 | 475.0 - 476.8 | 0.000 | 0.168 | 1.50 | 2.70 | |
| 13 | 486.3 - 489.5 | 0.000 | 0.012 | 0.060 | 0.193 | |
| Note: Negative flow is outflow from the borehole to the aquifer; positive flow is inflow to the borehole. | ||||||
During ambient testing, CS‑WB01 exhibited both vertical and horizontal flow. Five water-bearing zones were identified under ambient conditions. The uppermost interval was above the static water level, therefore, its exact location is undetermined. A downward vertical pressure gradient was observed in the corehole under ambient conditions. Ambient flow was observed to enter the wellbore above 225 feet at approximately 0.05 gpm and migrate downward. At 260 feet bgs ambient downflow of 0.02 gpm was observed, suggesting 0.03 gpm was lost, or exited, the well between 225‑260 feet. At 290 feet and 300 feet bgs, ambient downflow of 0.02 gpm was observed.
The BIPS identified features at depths correlating well with the HpL data. The features observed by the BIPS at water-bearing intervals identified from the HpL data had apparent aperture. Sixty-eight high-angle features (features of dip angle greater than 45 degrees) were identified, 10 of which had high probability of flow potential. Four of the high angle features that ranked qualitatively greater than one corresponded relatively well with flow intervals identified by HpL testing at 239.0‑242.5 feet, 271.5‑272.9 feet, and 305.5‑308.1 feet bgs.
Similar transmissivity and FEC estimates suggest an inter-connected network of fractures, karst features, or both in the immediate vicinity of the wellbore. A pressure differential present in the wellbore suggests the driving force for vertical communication is present and high-angle fractures with aperture may provide the conduit for vertical communication. The data acquired in CS‑WB01 exhibited similar interval-specific transmissivity and similar FEC estimates. A downward vertical gradient was observed in the wellbore; however, the bulk of the downward vertical flow in the well originated from above ambient water level. Major high-angle features in the corehole could provide conduits for vertical communication. Operations and findings are expounded upon in detail in Appendix C, COLOG Hydrophysical and Geophysical Logging Results Report.
Processing and interpretation of the geophysical and HpL logs for CS‑WB02 suggest the presence of one dominant water-producing interval below ambient water level. The results of these analyses are presented in Table 4.19. This interval correlates with a water-bearing zone identified during ambient testing (Figure 4.15). The interval at 301.4‑303.8 feet bgs dominated inflow during the production test, producing 0.909 gpm, or 64 percent of the total flow during the production test (Figure 4.16). During DIGW sampling, this zone yielded water at 5 gpm.
During ambient testing, boring WB02 exhibited vertical flow. One water-bearing zone was identified under ambient conditions. The interval was above ambient water level, therefore, its exact location was not ascertained. Groundwater enters the corehole at this interval, and migrates downward to exit at 301.4‑303.8 feet bgs. A downward vertical pressure gradient was observed in the wellbore under ambient conditions.
The well was also logged under ambient conditions with the HPF. The data acquired by the HPF also suggest the presence of a downward vertical gradient present in the wellbore at the time of testing. Ambient flow was observed to enter the corehole above 168 feet at approximately 0.50 gpm and migrate downward. Other heat-pulse flow meter test stations did not detect additional flow.
The BIPS identified features at depths correlating with the HpL data. The features observed by the BIPS at water-bearing intervals identified from the HpL data had apparent aperture. Twenty-one high-angle features were identified from the BIPS data. Six of the features had a high potential for flow. While logging with the BIPS, an inflow interval above ambient water level was identified at approximately 135 feet bgs. Discrete sample pumping with the packer apparatus across this zone yielded very low flow.
The data acquired in CS‑WB02 suggested a downward vertical gradient was present; however, all downward vertical flow in the well originated from above ambient water level. Major high angle features were identified in the corehole walls, providing potential conduits for vertical communication. The data are inconclusive as to whether the fractures intersecting the wellbore are or are not interconnected in the immediate vicinity of the wellbore. This conclusion is largely based on the lack of hydrostatic head on the uppermost inflowing interval.
Geophysical and HpL of CS‑WB03 suggest the presence of 13 producing intervals. Computer analyses estimated the rate of inflow for each identified hydraulically conductive interval during DI injection. The results of these analyses are presented in Table 4.19. The producing intervals correlate well with water-bearing zones identified during ambient testing (Figure 4.17). A large interval, 243.0‑306.0 feet bgs, dominated inflow during the production test, producing a total of 0.335 gpm, or 5 percent, of the total flow during the pumping portion of the test (Figure 4.18).
During static conditions testing, a downward vertical pressure gradient and downward vertical flow was observed in CS‑WB03, and four water-bearing zones were identified. Additionally, the corehole was logged under ambient conditions with the HPF. The data acquired by the HPF also suggest the presence of a downward vertical gradient in the open well at the time of testing. Ambient flow was observed to enter the wellbore above 114 feet at approximately 0.46 gpm and migrate downward. At 130 feet bgs, ambient downflow of 0.49 gpm was observed. At 150 feet bgs, ambient downflow of 0.56 gpm was observed. At 222 feet bgs, ambient downflow of 0.56 gpm was observed. At 297 feet bgs, 0.46 gpm of ambient downflow was observed. At 309 feet bgs, no ambient flow was observed.
Features observed by the BIPS at water-bearing intervals identified from the HpL data showed apparent aperture. Twenty-three high-angle features were identified from the BIPS data. Data analysis identified one feature as having good flow potential. This high-angle feature at 133.8 feet bgs also corresponds well with a flow interval identified at 133.5‑137.2 feet bgs. This feature was not prominent on the gamma and resistivity logs, and thus was not previously selected for DIGW sample collection.
The 13 interval-specific estimated transmissivities in CS‑WB03 ranged from 0.704 to 9.06 square feet per day (ft2/day) with the interval of 243.0 to 306.0 feet registering the highest transmissivity. The 13 interval-specific transmissivity estimates do not differ significantly with respect to each other. Fracture interconnectedness in the immediate vicinity of a wellbore can be inferred by the similar transmissivities, along with the presence of high-angle fractures and pressure differentials. Similar transmissivity and FEC estimates suggest an interconnected network of fractures or karst features in the immediate vicinity of the well.
The data acquired in CS‑WB03 exhibited similar interval-specific transmissivity and similar FEC estimates. A downward vertical gradient was observed in the wellbore. Major high angle features that could provide conduits for vertical communication were identified in the corehole. The low flow rates identified in the open well under pumping and ambient conditions may contribute to the similar transmissivity estimates. The data suggest the fractures intersecting the corehole are possibly interconnected in the immediate vicinity of the well.
Processing and interpretation of the geophysical and HpL logs in CS‑WB04 suggest the presence of 12 identified producing intervals for this corehole. Numerical modeling was performed to estimate the rate of inflow for each identified hydraulically conductive borehole interval during DI water injection procedures. The results of these analyses are presented in Table 4.19. The identified producing intervals correlate with water-bearing zones identified during static conditions testing (Figure 4.19). The interval at 332.2‑335.3 feet dominated inflow during the production test, producing a total of 2.73 gpm or 46 percent, of the total flow during the test (Figure 4.20). The 12‑foot interval encompassing this zone during DIGW sample collection yielded 7.1 gpm during pumping.
During ambient testing, CS‑WB04 fluid exhibited downward vertical flow. Ten water-bearing zones were identified under ambient conditions. A downward vertical pressure gradient was observed in the wellbore under ambient conditions. The wellbore was logged under ambient conditions also with the HPF. The data acquired by the HPF suggest the presence of a downward vertical gradient present in the wellbore at the time of testing. Ambient flow was observed to enter the wellbore above 195 feet at approximately 0.02 gpm and migrate downward. At 221 feet ambient downflow of 0.04 gpm was observed. At 247 feet ambient downflow of 0.08 gpm was observed. At 270 feet ambient downflow of 0.07 gpm was observed. At 325 feet 0.09 gpm of ambient downflow was observed. At 352 feet ambient downflow of 0.07 gpm was observed. At 450 feet 0.06 gpm of ambient downflow was observed. At 490 feet no ambient flow was observed.
The BIPS identified features at depths correlating well with the HpL data. The features observed by the BIPS at water-bearing intervals identified from the HpL data had apparent openings. Fifty-two high-angle features were identified from the BIPS data. Six of the features had good flow potential. Two of these high-angle features correspond well with identified flow intervals at 177.7 to 179.5 and 227.9 to 229.0 feet. The twelve interval-specific estimated transmissivities in CS‑WB04 ranged from 0.019 to 40.0 ft2/day with the interval of 332.2‑335.3 feet registering the highest transmissivity. With the exception of the interval from 208.2 to 210.8 feet, the interval-specific transmissivity estimates do not differ significantly with respect to each other, and this exception is most likely due to the size and low flow of this interval. The data acquired in CS‑WB04 exhibited similar interval-specific transmissivity and similar FEC estimates, indicating some fracture interconnectedness in the immediate vicinity of the boring. A downward vertical gradient was observed in the wellbore. Major high angle features were identified in the wellbore that could very well be providing conduits for vertical communication.