[Home]
[Table of Contents] [Next Section]
Three-Tiered Long Term Monitoring Network Optimization Evaluation
Section 5 - Temporal Statistical Evaluation
Chemical concentrations measured at different points in time (temporal data) can be examined graphically or using statistical tests, to evaluate dissolved-contaminant plume stability. If removal of chemical mass is occurring in the subsurface as a consequence of attenuation processes or operation of a remediation system, mass removal will be apparent as a decrease in chemical concentrations through time at a particular sampling location, as a decrease in chemical concentrations with increasing distance from chemical source areas, and/or as a change in the suite of chemicals detected through time or with increasing migration distance.
5.1 - Methodology for Temporal Trend Analysis of Contaminant Concentrations
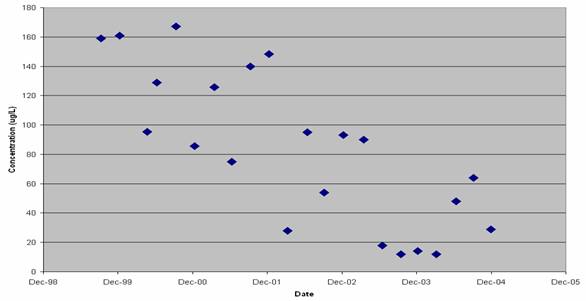
Temporal chemical-concentration data can be evaluated for trends by plotting contaminant concentrations through time for individual monitoring wells (Figure 5.1), or by plotting contaminant concentrations versus downgradient distance from the contaminant source for several wells along the groundwater flowpath, over several monitoring events. Plotting temporal concentration data is recommended for any analysis of plume stability (Wiedemeier and Haas, 2000); however, visual identification of trends in plotted data may be a subjective process, particularly if (as is likely) the concentration data do not exhibit a uniform trend, but are variable through time (Figure 5.2).
Figure 5.1 - PCE Concentrations through Time at Well CS-16-LGR
The possibility of arriving at incorrect conclusions regarding plume stability on the basis of visual examination of temporal concentration data can be reduced by examining temporal trends in chemical concentrations using various statistical procedures, including regression analyses and the Mann-Kendall test for trends. The Mann-Kendall nonparametric test (Gibbons, 1994) is well-suited for evaluation of environmental data because the sample size can be small (as few as four data points), no assumptions are made regarding the underlying statistical distribution of the data, and the test can be adapted to account for seasonal variations in the data. The Mann-Kendall test statistic can be calculated at a specified level of confidence to evaluate whether a statistically significant temporal trend is exhibited by contaminant concentrations detected through time in samples from an individual well. A negative slope (indicating decreasing contaminant concentrations through time) or a positive slope (increasing concentrations through time) provides statistical confirmation of temporal trends that may have been identified visually from plotted data (Figure 5.2). In this analysis, a 90 percent confidence level is used to define a statistically significant trend.
The relative value of information obtained from periodic monitoring at a particular monitoring well can be evaluated by considering the location of the well with respect to the dissolved contaminant plume, potential receptor exposure points, and the presence or absence of temporal trends in contaminant concentrations in samples collected from the well. The degree to which the amount and quality of information that can be obtained at a particular monitoring point serve the two primary (i.e., temporal and spatial) objectives of monitoring that must be considered in this evaluation. For example, the continued non-detection of a target contaminant in groundwater at a particular monitoring location provides no information about temporal trends in contaminant concentrations at that location, or information about the extent to which contaminant migration is occurring, unless the monitoring location lies along a groundwater flowpath between a contaminant source and a potential receptor exposure point (e.g., downgradient of a known contaminant plume). Therefore, a monitoring well having a history of contaminant concentrations below detection limits may be providing little or no useful information, depending on its location.
A trend of increasing contaminant concentrations in groundwater at a location between a contaminant source and a potential receptor exposure point may represent information critical in evaluating whether contaminants are migrating to the exposure point, thereby completing an exposure pathway. Identification of a trend of decreasing contaminant concentrations at the same location may be useful in evaluating decreases in the areal extent of dissolved contaminants, but does not represent information critical to the protection of a potential receptor. Similarly, a trend of decreasing contaminant concentrations in groundwater near a contaminant source may represent important information regarding the progress of remediation near, and downgradient from the source. By contrast, the absence of a statistically significant (as defined by the Mann-Kendall test with a 90 percent confidence level) temporal trend in contaminant concentrations at a particular location within or downgradient from a plume indicates that virtually no additional information can be obtained by frequent monitoring of groundwater at that location, in that the results of continued monitoring through time are likely to fall within the historic range of concentrations that have already been detected (Figure 5.3). Continued monitoring at locations where no temporal trend in contaminant concentrations is present serves merely to confirm the results of previous monitoring activities at that location.
The temporal trends and relative location of wells can be weighed to determine if a well should be retained, excluded, or continue in the program with reduced sampling. Figure 5.4 presents a flowchart demonstrating the methodology for utilizing trend results to draw these conclusions.
5.2 - Temporal Evaluation Results
The analytical data for groundwater samples collected from the 139 sample points in the CSSA LTM program from September 1991 through December 2004 were examined for temporal trends using the Mann-Kendall test. The objective of the evaluation was to identify those wells having increasing or decreasing concentration trends for each COC, and to consider the quality of information represented by the existence or absence of concentration trends in terms of the location of each monitoring point. Increasing or decreasing trends are those identified as with positive or negative slopes, respectively, by the Mann-Kendall trend analysis with a confidence level of 90 percent.
Summary results of Mann-Kendall temporal trend analyses for COCs in groundwater samples from CSSA are presented in Table 5.1. Trends for eight potential COCs (PCE, TCE, DCE, PB, TMBE, BDCME, BZME, and VC) were evaluated to assess the value of temporal information for each well. As implemented, the algorithm used to evaluate concentration trends assigned a value of �ND� (not detected) to those wells with sampling results that were consistently below analytical detection limits through time, rather than assigning a surrogate value corresponding to the detection limit � a procedure that could generate potentially misleading and anomalous �trends� in concentrations. In addition, a value of �<PQL� was assigned to those constituents for which no values were measured above the practical quantitative limit (PQL), i.e., all sample results were either ND or trace. For example, PCE results for groundwater samples from well CS-11 include three trace detections of 0.41 mg/L, 0.16 mg/L, and 0.062 mg/L on 6/14/00, 3/19/01, and 3/14/02, respectively, and 24 measurements in which PCE was not detected. In the absence of the �<PQL� classification category, results of trend analysis would indicate a �no trend� result for PCE in those samples, which is primarily an artifact of the analytical procedures, and could generate false conclusions regarding concentration trends. The color-coding of the Table 5.1 entries denotes the presence/absence of temporal trends, and allows those monitoring points having nondetectable concentrations, decreasing or increasing concentrations, or no discernible trend in concentrations to be readily identified. The 14 sample points that had fewer than four analytical results for each of the COCs could not be analyzed using the Mann-Kendall trend analysis, and have a �<4Meas� and/or �No Data� designation. Figure 5.5 displays the Mann-Kendall results for PCE thematically by well for LGR zone wells, along with each well�s relative plume location designation (e.g., downgradient, upgradient).
The basis for the decision to exclude, reduce sampling or retain a well in the monitoring program based on the value of its temporal information is described in the �Rationale� column of Table 5.1, and a flow chart of the decision logic applied to the temporal trend analysis results is presented in Figure 5.4. Trend results from PCE, TCE, DCE and Pb were given more weight than those from the other potential COCs given their relatively higher impact. Monitoring wells not considered �sentry� wells at which concentrations of COCs consistently have been non-detected or <PQL through time (e.g., CS-MW4-LGR, CS-MW10-CC, CS-MW11A-LGR, DOM-2, HS-3) represent points that do not generate useful temporal information, and typically can be recommended for exclusion or reduced monitoring. Additionally, wells located downgradient of the source area that have either decreasing concentrations or a recent history of concentrations below MCLs (e.g., CS-MW2-LGR, AOC-65-PZ05, LS-2, and CS‑WB01‑LGR05) will provide limited valuable temporal information in the future and are recommended for exclusion or reduced sampling. Conversely, monitoring wells (e.g., CS‑16‑LGR, CS-WB03-LGR04) that exhibit decreasing temporal trends in a source area with recent concentrations above MCLs are valuable and should be retained because they provide information on the effectiveness of the remediation system. Additionally, downgradient wells with increasing COC concentration trends (e.g., wells CS-4, CS-11, CS-MW1-LGR) provide valuable information about potential migration of contaminants, and should be retained. Wells with stable and/or low �no trend� results were recommended for exclusion or monitoring reduction (e.g., wells CS-MW10-LGR, CS-MW5-LGR) because continued frequent sampling would not likely yield new information, while wells with highly variable COC concentrations (e.g., wells CS-MW1-LGR, LS-6) were recommended for retention. Recommendations in wells that had different Mann-Kendall trend results for different COCs were based on the most conservative analysis.
Table 5.1 summarizes recommendations to retain 44 and exclude or reduce 81 of the 125 wells analyzed in the temporal evaluation (not including the 14 wells with fewer than four measurements) analyzed to optimize the monitoring program for CSSA. The recommendations provided in Table 5.1 are based on the evaluation of temporal statistical results only, and must be used in conjunction with the results of the qualitative and spatial evaluations to generate final recommendations regarding retention of monitoring points in the LTM program, and the frequency of monitoring at particular locations at CSSA.