[Home] [Master Table of Contents]
[Table of Contents] [Next Section]
AOC-50 Closure Report
Section 2 - Closure Activities
Additional excavation of waste and waste residue at AOC‑50 was conducted on November 21, 2003. During this period, approximately 900 CY of soil were excavated from the site. Further excavation occurred from February 2004 to April 2004.
Excavated material was stockpiled onsite so that the material could be characterized for disposal. Disposal of the 2003/2004 waste was conducted under waste profile CG‑16007. These waste manifests plus manifests from waste generated in 2001 (see Section 1.4.4) are provided in Appendix A. Toxicity characteristic leaching procedure (TCLP) results from the stockpiled waste indicated the material met Class 2 criteria, so the waste was disposed at Covel Gardens Landfill.
Following excavation and disposal of waste material at AOC‑50, the site was backfilled with clean fill, graded, and revegetated.
Confirmation sampling was performed from January through April 2004. A total of seven sidewall samples and 13 bottom samples were collected at the site. After further excavation, areas where previous sampling produced results that exceeded CSSA soil background limits were sampled.
All original samples were analyzed for chromium, copper, zinc, cadmium, and lead. If a sample exceeded RRS1 for one of these constituents, the original sample location was overexcavated and a new sample was collected and analyzed for only those constituents that exceeded RRS1. Overexcavation was conducted until bedrock was encountered.
Most of the RRS1 exceedances were resolved through overexcavation and resampling. One exceedance, a copper result for AOC50‑BOT01, was not resolved through overexcavation and resampling. Since enough samples had been collected and analyzed for copper at the site, statistical analysis was employed to calculate UCL for copper results at the site.
If a portion of the site samples exceed RRS1, 30 TAC §335.553(d)(2) allows the use of statistical comparison using the 95% confidence limits of the mean concentration of the contaminant as a representative value for the site. If all of the samples across the site are used to calculate an upper confidence limit (UCL), and the UCL is less than the established background level, the site can be closed under RRS1.
To calculate the UCL, the data must be normally or log‑normally distributed. To test the distribution of the data, the Shapiro‑Wilk test of normality is used (if sample sizes are less than or equal to 50). The Shapiro‑Wilk test is included in the EPA software, ProUCL, used for the UCL calculations (EPA 2003; also located at: http://www.epa.gov/esd/tsc/install.htm). If the distribution is normal, the UCLs are calculated on the raw data. If the distribution is not normal, then the data are log transformed, and the Shapiro‑Wilk test of normality applied to the transformed data. If the data were log‑normally distributed, the UCLs were calculated based on the transformed data. If the Shapiro‑Wilk test statistic (W) exceeds the critical value of the statistic, then that distribution is considered normal or log‑normal, according to the distribution of the data.
For log‑normally distributed data, the standard UCL is generally the Land’s H‑statistic. However, if the data are skewed (if the standard deviation of the log‑transformed data, σ, is greater than 1.0), then an alternate computation of the UCL must be used. If the following is true, 1.0 ≤ σ ≤ 1.5 and there are fewer than 25 observations in the data set, then the 95% Chebyshev UCL should be used to correct for skewness (see EPA 2003 for further details).
Using all of the samples collected during the closure sampling, copper was statistically analyzed. For samples where a field duplicate was collected, the higher of the two sample results was used for statistical evaluation.
The AOC‑50 closure samples for copper are log‑normally distributed. The Land’s H‑statistic UCL is the most appropriate UCL calculation for the data. The 95% Land’s H‑statistic UCL for the copper results is 19.07 mg/kg, which is less than the RRS1 soil background concentration of 23.2 mg/kg for copper. The statistical evaluation table is provided in Appendix B.
Results from the confirmation sampling are presented in Table AOC50‑6. Sample locations are shown on Figure AOC50‑12. An analytical results summary is presented in Appendix C.
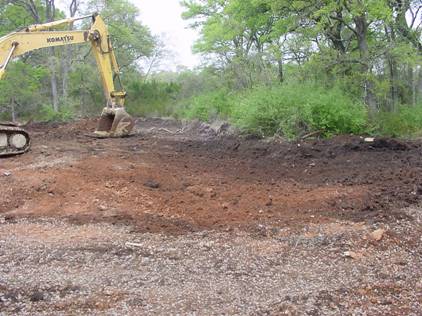
AOC-50 Excavation area, February 2004
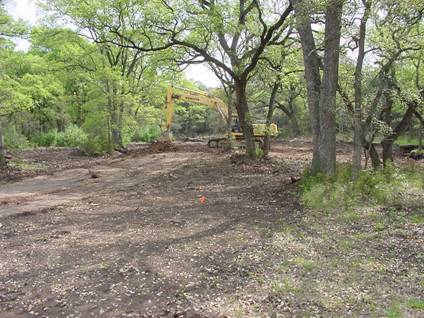
AOC-50 Excavation area, February 2004