[Home] ]
[Table of Contents] [Next Section]
Field Demonstration Work Plan for ESTCP Project 20020 - PIMS
Section 3 - Demonstration Design
Performance objectives are simple and few. Ease of emplacement will be tested. It is anticipated this activity is expected to take 2 weeks. Success of the treatment system will be demonstrated by monitoring the leachate and determining whether lead is prevented from leaving the soils in concentrations over the maximum contaminant level (MCL) of 15 ppb.
Table 3-1 - Performance Objectives
| Type of Performance Objective | Primary Performance Criteria | Expected Performance (Metric) | Actual Performance Objective Met (future) |
| Qualitative | 1. Reduce Pb mobility | <15 ppb Pb in leachate from treated site soils (USEPA) | |
| | 2. Faster remediation | About 2 week field implementation | |
| | 3. Ease of Use | Easy soil mixing | |
| Quantitative | 1. Meet regulatory standard | <15 ppb Pb in leachate from treated site soils (USEPA) | |
As this technology is ideally suited for lead contaminated media, the test site was chosen because of its lead contamination. The site is also very representative of many sites across the DoD Complex, both in contaminant type and field characteristics. The site was also chosen because of enthusiasm by key players and stakeholders, and the good existing infrastructure.
3.3 - Test Site History/Characteristics
The land on which CSSA is located was used for ranching and agriculture until the 1900's. During 1906 and 1907, six tracts of land were purchased by the U.S. Government and designated the Leon Springs Military Reservation. The reservation was used for maneuvers by Army and National Guard units, and the lands included campgrounds and cavalry shelters. In October 1917, the installation was redesignated Camp Stanley (see Figure 3.1). U.S. involvement in World War I spurred extensive construction of temporary cantonments and installation support facilities. In 1931, Camp Stanley was selected as an ammunition depot, and construction of standard and igloo magazines began in 1938 (Army, 1990). Camp Stanley was transferred to the jurisdiction of the Red River Army Depot (RRAD) in 1947. In addition to ammunition storage, CSSA lands were used to test, fire, and overhaul ammunition components.
According to a 1950 memorandum on file at CSSA, the B‑20 area (see Figure 3.2) was first used for demolition activities on March 4, 1946 (CSSA, 1950). B-20 operations included detonation of conventional explosive ordnance and other ordnance items, disposal of scrap metal from detonation activities, and disposal of small arms ammunition. There are no known records describing use of the B-20 site between 1946 and 1980. However, review of aerial photographs from this period suggests the site was periodically in use. Records and personnel employed at CSSA indicate the site was used intermittently from 1980 through 1987. CSSA received a Corrective Action Compliance Order from the USEPA for the site in June 1993.
The following chronology lists relevant activities at the B‑20 unit since the first known use of the site in 1946.
Table 3.2 - Activities at Site B-20
| Year | Month | Action/Results | Action Performed By |
| 1946- 1987 | NA | B-20 area (approximately 33.5 acres) was used periodically for ordnance OB/OD activities. On an unknown date, sand and spent ammunition from the practice firing building at CSSA were disposed of at the B-21 area, which is immediately adjacent to B-20. | CSSA |
| 1993 | June | A Compliance Order was issued for the B-20 site for unpermitted treatment of hazardous waste and for failure to have a closure plan. | USEPA |
| 1994 | January | Preliminary samples were collected from the B-20 area to provide an estimation of the nature and extent of contamination for environmental investigation planning purposes. | RRAD |
| | March | Partial Facility Closure Plan for B-20 (ES, 1994) closure/remedial investigation was submitted to USEPA Region VI and TNRCC. | Parsons ES |
| | November- December | First phase of closure/remedial investigation was conducted at B-20. UXO was cleared from within the original site boundary, and geophysical surveys were conducted to identify anomalies in craters. Total of 812 UXO items removed. Surface soil, subsurface soil, surface water, and sediment were sampled and analyzed for metals and explosives. Surface water and sediment samples were also analyzed for VOCs. Barium, cadmium, lead, and mercury levels exceeded RRS1. | Parsons ES |
| 1995 | June | Final Remedial Investigation Report (Parsons ES, 1995a) for B‑20 submitted. Report recommended additional sampling and UXO clearing activities. | Parsons ES |
| 1995 | September | Amendment to Project Plans (Parsons ES, 1995b) submitted to regulatory agencies for second phase of sampling. Second phase of remedial investigation conducted. Subsurface soils sampled near three first phase RI borings to determine if metals failed SPLP test. Surface soils sampled in south-central portion of site to better delineate extent of metals contamination. | Parsons ES |
| 1995 | October | USFWS sent a letter of concurrence for planned vegetation clearing activities at the B-20 site. | USFWS |
| 1995 | December | Second Amendment to Project Plans (Parsons ES, 1995c) submitted to regulatory agencies. | Parsons ES |
| 1996 | January - March | Field activities conducted, including vegetation clearing to facilitate UXO identification, systematic sweep of surface for UXO with magnetometers within original site and perimeter, excavation and removal of buried UXO in craters, excavation and removal of buried UXO in northern 5 acres of site, and collection and disposal of scrap metal scattered over the surface of the site. | Parsons ES |
| | January | All UXO items found on site to date (365 items) were detonated after receiving approval from TNRCC on January 29. | CSSA Parsons ES UXB |
| | May | UXO items identified since January 31 (447 items) were detonated on site. | |
| | June | Addendum to the Remedial Investigation Report (Parsons ES, 1996b) submitted. Report recommended additional UXO clearing activities. | Parsons ES |
| 1997 | January | Third Amendment to Project Plans for Remedial Investigation submitted. | Parsons ES |
| | January-September | East extension to B-20 was cleared of vegetation and systematically swept for UXO. Soils from northern 5-6 acres of the site were sifted to remove UXO and metal scrap. | Parsons ES |
| | March-April | Phytoremediation, soil washing, and stabilization bench-scale treatability studies conducted. | Parsons ES Phytotech Brice Eagle Const. |
| 1999 | April | USEPA Memorandum indicated analytical results obtained from ITS are not usable for closure or compliance. | USEPA |
| 1999 | April | TNRCC�s early April inspection resulted in a requirement for B-20 waste removal. Initiated UXO investigation/mitigation actions for �Hot Soil� located at B-20. UXO removal was accomplished on approximately 80 cubic yards of soils at the B-20 site. | Parsons ES USA Environmental |
| 1999 | July | �Hot Soils� contaminated with hazardous lead levels were transported and disposed of in accordance with applicable regulations. Approximately 100 tons of soil were removed from B-20. | Parsons ES Eagle Const. Texas Ecologist |
| 1999 | November | Submitted work plan for resampling to replace analytical chemistry data generated by ITS Laboratory. | Parsons ES |
| 2000 | March | Advanced 8 borings for Rework (SB1-8) and collected 16 samples for explosives analysis. | Parsons ES Data Chem |
| | April | Collected 5 sift samples (Sift19-23 for rework) for metals and explosives analysis. | Parsons ES O�Brien &Gere Data Chem |
| | | Collected 13 sift samples for VOCs, SVOCs, metals and explosives (3 samples) and metals only (10 samples). | Parsons ES APPL, Inc. Data Chem |
| 2001 | January | Collected additional sift soil samples for TCLP metal analyses from the previously identified �hot spots� for �worst case� leaching data. | Parsons ES APPL, Inc. |
In February 1994, prior to the remedial investigation, an investigation was conducted at the B‑20 site to obtain preliminary data on site features and possible contaminants for use in determining remedial investigation needs. CSSA and RRAD, with the agreement of USEPA Region VI RCRA Enforcement, Texas Section, prepared a �Phase I sampling plan� and conducted the preliminary investigation in accordance with this plan.
The first objective of the preliminary investigation was to map B‑20 site features, including boundaries, crater locations, and surface water features. The map prepared during the preliminary investigation was used to determine sampling locations for the remedial investigation. No unexploded ordnance (UXO) was identified during preliminary mapping.
Secondly, samples were collected from areas of possible contamination to determine appropriate analytical parameters for the remedial investigation. Samples were collected from within four craters, near one soil mound, from the small pond, and from the livestock pond. A total of four surface soil samples, three surface water samples, three sediment samples, four background soil samples, and associated quality assurance/quality control (QA/QC) samples were collected. Samples were analyzed for explosives (USEPA SW‑846 method 8330), volatile organic compounds (SW‑8240), base/neutral/acid extractable semivolatile organic compounds (SW‑8270), pH (water only), and total metals (SW‑6010).
In 1994 and 1995, a number of surface soil, subsurface soil, sediment, surface water and groundwater samples were collected at the B-20 site. Analyses were conducted by Terra Laboratory, with the exception of explosives analyses, which were conducted by ITS Laboratory. Surface clearance of UXO of the entire B-20 site was also initiated during this period.
A total of 13 soil borings were drilled and sampled at the B-20 site. SB1 through SB10 were part of the initial investigation of the site. SB11, SB12, and SB13 were drilled adjacent to SB10, SB9, and SB2, respectively, for collection of samples for synthetic precipitation leaching procedure (SPLP) and toxicity characteristic leaching procedure (TCLP) metals.
Subsurface clearance of UXO at the B-20 site was initiated in Spring of 1997. Subsurface clearing was accomplished on approximately 6 acres of soil located in the northern portion of SWMU B-20. These soils were removed and sifted to recover UXO and metal fragments within the soil matrix. Approximately 2,500 cubic yards of sifted soils are currently in piles within the B-20 site. Samples were collected from the soil piles and analyzed for lead by ITS Laboratory. During this period, perimeter areas to the north and south of the site were also surface-cleared of UXO.
In addition, five soil mounds in the eastern part of the site were leveled and each of the thirteen craters scattered throughout the site were filled in with surrounding soils. A majority of the site, with the exception of the northeast corner and the eastern edge, was graded and seeded to prevent soil erosion.
In July 1999, approximately 100 cubic yards of spent small arms ammunition and soil contaminated with lead from SWMUs B-20 and B-21 were removed and disposed as a hazardous waste at the Texas Ecology Landfill located in Robstown, TX.
Climate
CSSA is located in south‑central Texas on the Balcones Escarpment. Northwest of the installation the terrain slopes upward to the Edwards Plateau; to the southwest, the terrain slopes downward to the Gulf Coastal Plains. This results in a modified subtropical climate, predominantly marine during the summer months, and continental during the winter months. Summers are hot with daily temperatures above 90�F over 80 percent of the time, and winters are mild with below freezing temperatures occurring on an average of only about 20 days per year. Temperature extremes have ranged from 0�F to 108�F.
CSSA is situated between a semi‑arid region to the west and the coastal area of heavy precipitation to the southeast. Average annual rainfall is approximately 29 inches. Precipitation is fairly well distributed throughout the year, with the heaviest amounts occurring in May and September. Approximately 61 percent of rainfall occurs from April through September and is primarily due to thunderstorms. During this period, large amounts of precipitation may fall in a short period of time. Most winter precipitation occurs as light rain or drizzle; however, thunderstorms accompanied by heavy rain occur in all months of the year.
Topography
CSSA is characterized by a rolling terrain of hills and valleys in which nearly flat‑lying limestone formations have been eroded and dissected by streams draining primarily to the east and southeast. Physiography of the B‑20 site is influenced by native topography, underlying geology, and artificial terrain modifications caused by explosive demolition and earth moving activities. Fifteen craters resulting from demolition activities at the B‑20 site range in depth from approximately 1 to 6 feet below grade.
Resistive limestone beds outcrop as topographic highs, but none form buttes or mesas. Rather, the predominant physiographic features are hills and �saddles� which lead to stream valleys. Topographic relief across CSSA ranges from about 1,100 feet to 1,500 feet above mean sea level (MSL). Elevations at the B‑20 unit range from 1,360 feet above MSL on the west, to about 1,300 feet above MSL on the east.
Sinkholes are present at CSSA, primarily in areas where porous and fractured limestone formations are exposed. However, no sinkholes were observed or encountered during drilling activities at the B‑20 site.
Drainage and Surface Water
River and stream dissection of limestone is the major surface feature at CSSA and the B‑20 site. Most major rivers and streams originating in the Edwards Plateau to the northwest of CSSA tend to follow northwest‑southeast regional fracture patterns. Drainage from CSSA generally flows in a southerly direction into Salado Creek and Leon Creek, with a small portion in the northeast draining into Cibolo Creek. Approximately 75 percent of CSSA is in the Salado Creek watershed, 15 percent in the Cibolo Creek watershed, and 10 percent in the Leon Creek watershed. All these streams are intermittent at CSSA. The B‑20 site is located within the Cibolo Creek watershed, approximately 1.5 miles south of Cibolo Creek.
Drainage at the B‑20 site is generally to the northeast in two runoff channels within the Cibolo Creek watershed. The larger channel begins just north of the gravel road at the southern site border, drains into a small pond, and continues northeast to the livestock pond. Surface area of the pond is less than one acre. An earthen dam exceeding 6 feet in height causes collection of surface water in the livestock pond. The smaller channel runs northeast along the eastern site boundary until it branches into the larger channel. Both channels are ephemeral, and the ponds are dry during periods of little to no precipitation. Due to higher elevations north, west, and south of the site, these two channels receive all site runoff.
Soils
Generally, soil types at CSSA are dark‑colored, gravelly clays and loams. According to the USDA Soil Conservation Service (SCS) soil survey for Bexar County, Texas, soil types at the installation include Brackett‑Tarrant association, Brackett soils, Crawford and Bexar stony soils, Krum complex , Lewisville silty clay, Tarrant association, and Trinity and Frio soils.
The soil horizon at the B‑20 site is typically thin, ranging from 0.5 to 6 feet in thickness across the site. Only the Brackett‑Tarrant association, Crawford and Bexar stony soils, and Krum complex occur at B‑20. These three soil types are described in detail below.
Brackett‑Tarrant association soils occur on hills in the west‑central and northern portions of the B‑20 site. Typically, Tarrant soils are on the tops and the upper sides of ridges, just above Brackett soils. Both soil types are underlain by Glen Rose limestone. Tarrant soils consist of a clayey, very dark grayish‑brown, calcareous surface layer which is up to approximately 10 inches thick. Various amounts of limestone gravel occur within the profile. Brackett soils consist of grayish‑brown, gravelly clay loam. Brackett soils are lighter colored, less clayey, and less stony than Tarrant soils. Brackett soils are also strongly calcareous.
Crawford and Bexar stony soils occur in the north‑central and southeastern portions of the B‑20 site on broad, level to gently undulating areas. Both Crawford and Bexar soils are moderately deep. The Crawford type soils have a dark grayish brown to dark reddish brown surface layer that is generally 12 to 16 inches thick. The subsurface layer is a blocky, reddish‑brown, noncalcareous stony clay that developed over broken limestone. The pH of typical Crawford soils ranges from 7.5 to 8.0. The Bexar soils are dark reddish‑brown, cherty clay loams or gravelly loams. The slope range for Bexar soils is 0 to 8 percent. Bexar soils are redder, less clayey, and more cherty than Crawford soils. The pH of typical Bexar soils ranges from 6.0 to 6.5.
The Krum complex soils are located in infrequently flooded streambeds such as those in the eastern and northeastern areas of B‑20. Typically, these soils occupy foot slopes below Tarrant and Brackett soils. These soils receive runoff and additional sediments from higher lying soils. Krum complex soil is dark grayish-brown, calcareous, and ranges from silty clay loam to gravelly clay. The pH of typical Krum clay is 8.0.
Structure
The Balcones Fault Zone is a large regional fault system located in the Camp Stanley area. It is comprised of a series of high angle normal faults that generally trend in a northeast to southwest direction. In most cases, the northwest fault blocks have moved up in relation to the southeast blocks. Because of differential erosion associated with this movement, older rocks are typically exposed on the upthrown (northwest) block and younger deposits are typically found exposed on the downthrown (southeast) block. In northwest Bexar County, total displacement along this fault is approximately 1,200 feet. Regional dip in the area is on the order of 10 to 15 feet per mile. However, dips of up to 100 feet per mile have been noted within the fault zone.
Two northeast to southwest trending fault zones have been identified at Camp Stanley. One of these faults crosses the central portion of the base while the other is located near the southern perimeter. The fault zone in the central portion of the base is characterized as a series of several small faults with displacements ranging up to a maximum of 30 feet. The fault along the southern base perimeter appears to be a single fault trace with displacement estimated at about approximately 65 feet. As a result of the regional faulting, many fracture systems have developed in the Cretaceous deposits, collected from areas of highest �total� metal contamination and will be used to characterize TCLP levels for the �worst case� scenario. This work was performed by Parsons ES.
Stratigraphy
Camp Stanley is underlain by approximately 1,000 feet of Cretaceous deposits made up of the Glen Rose and Travis Peak formations. Paleozoic schist underlies the Cretaceous deposits.
The Glen Rose represents a thick sequence of shallow marine deposits. It is subdivided into Upper and Lower units by a widespread stratigraphic marker known as the Corbula fossil bed (a bed of clam shells 3 to 5 millimeters in diameter). A gypsum bed is often associated with the contact. The Upper Glen Rose is comprised of alternating beds of limestone, marly limestone, blue shale, and occasional gypsum beds. The Lower Glen Rose consists of massive fossilferous limestone grading upward into thin beds of limestone, marl, and shale. Because of relatively thin soil cover at Camp Stanley, outcrops of the Glen Rose are common. At the B-20 site, the Glen Rose is 300+ feet thick.
The Travis Peak formation underlies the Glen Rose. The Travis Peak is subdivided into five units. In ascending order, these units are: Hosston Sand/Sligo Limestone, Hammet Shale, Cow Creek Limestone, and the Hensell Sand (locally known as the Bexar Shale). The Travis Peak is approximately 700 feet thick at Camp Stanley.
Hydrogeology
There are three aquifers in the Cretaceous‑aged rock strata underneath CSSA: the upper, middle, and lower Trinity aquifers. Most production and monitoring wells at CSSA are completed in the middle Trinity aquifer. This aquifer is promoted by solution‑enhanced permeable fractures and is the primary source of potable water at CSSA as well as most of the surrounding residential area�s potable water needs. The middle Trinity aquifer encompasses the lower member of the Glen Rose, Bexar Shale, Cow Creek limestone, and Hammett shale formations and the upper part of the underlying Travis Peak formation. Water levels of the middle Trinity appear to be seasonally variable. Depths to water in CSSA Well 1, located about 500 feet northeast of the B‑20 site and completed in the middle Trinity aquifer, ranged from approximately 219 feet below ground level in May 1994 to 277 feet below ground level in December 1994. This aquifer is described in detail in the �Hydrogeologic Report for Evaluation of Groundwater Contamination at Camp Stanley Storage Activity, Texas�.
The upper Trinity aquifer is located within the upper member of the Glen Rose formation. The upper Glen Rose is exposed over much of the B‑20 site. Recharge to the upper Trinity aquifer is from direct precipitation on the outcrop of the upper member of the Glen Rose formation and stream flow losses. Movement of groundwater in the upper Trinity aquifer is restricted to lateral flow along bedding planes between marl and limestone, where dissolution has enhanced permeability of the limestone. During drilling at the B‑20 site, groundwater was encountered in one of the soil borings (SB1) within a zone of interbedded marl and limestone. Occurrence of groundwater in this aquifer is sporadic and dependent on precipitation and secondary porosity features, indicating that beds within this aquifer are perhaps not hydraulically connected by avenues of vertical permeability. The upper Trinity aquifer is under water table conditions, it is generally of poor quality, and most wells achieve only low production
Presently, the primary mission of CSSA is receipt, storage, issue, and maintenance of ordnance materiel, as well as quality assurance testing and maintenance of military weapons and ammunition. CSSA also has an agreement with the United States Department of Agriculture (USDA) Agricultural Research Service, which permits cattle grazing on CSSA lands. Military personnel or other parties are allowed to hunt wildlife on a restricted basis in the outer cantonment area. Although RRAD is proposed for realignment, no changes to the CSSA mission and military activities are expected in the future.
3.5 - Pre-Demonstration Testing and Analysis
CSSA and Parsons ES performed extensive testing and evaluation of these soils and this site. Some of this material is attached as Appendix A. Treatability Study analyses are shown in this section.
UFAV performed a treatability study to determine the effect of Apatite II on soluble lead and its expected performance in the field. UFA also wanted to determine lead concentrations that could leach from the site under various conditions, even if a worst case situation occurred with highly acidic infiltration over many years. Batch tests provide gross information about whether or not an effect will be seen and some information about materials relative to one another. Batch tests do not reflect field conditions and should not be used to make strategy or design decisions. Column tests are tests that actually reflect what will occur in the field, but only if run with actual materials, soils, and water from the field or materials that will be used in the field.
The treatability study consisted of a series of batch tests and soil column leaching tests. Batch tests were run in the standard way with a 1:10 soil to water ratio, shaken for 24 hours, decanted, and filtered through 0.25 micron filters. Soil collected from the piles was treated with 0 percent, 2 percent, 5 percent and 10 percent by weight of Apatite II by simple hand mixing similar to mixing procedures that will occur in the field with a paddle mixer. The batch solution and the column effluent solutions were analyzed primarily for dissolved lead, but also periodically for pH and other elements of interest. After initial tests, 10 percent Apatite II was dropped from the test matrix.
Column tests were set up to replicate the field demonstration, i.e., the columns were 7.2 inches (18.3 cm) long with a diameter of 3.5 inches (9 cm) with a 0.72 inch (1.8 cm) layer of Apatite II overlain by 6.48 inches (16.5 cm) of treated soil. The total soil volume was 70 cubic inches (1160 cm3). This provided the scaled geometry from that anticipated in the field, i.e., 2 to 4 inches of Apatite II overlain by 3 to 4 feet of treated soil. At the steady-state flow rate, the moisture content of the soil was 13.8 percent by volume giving a pore volume of 160 mL. A pore volume is the amount of water in the soil at any one time and is the unit of flow used to normalize column tests for comparison to each other and to the field. Infiltration rates used were 6.67 mL/hr, which were high, to be conservative. This gave 1 pore volume of water flowing through each column per day for each column every day. The columns were run for 17 pore volumes, which simulated more than 17 years of leaching at the site under the highest of historical rainfall conditions, over 16 inches of rain per year.
To bound various future uses of the site and possible climatic changes, three water compositions were used as the influent for infiltration:
Tap water of the same composition as irrigation water that could be used at the site and that reflects the normal residential use anticipated for the site,
SPLP solutions (pH 3.8, low ionic strength) similar to lightly acidic infiltration that can occur with acid rain, or after application of some fertilizers, that reflect what might occur with commercial or even some residential uses, and
TCLP solutions (pH 2.9, higher ionic strength), the most aggressive of USEPA leaching solutions reflecting industrial uses of the site, inadvertent chemical discharges, or an extreme change in environmental conditions.
All chemical analyses were performed according to USEPA-approved protocols, using SW6010 or SW6020. Tap water was analyzed for metals and the results provided in Table 3.3. The SPLP and TCLP solutions were synthesized according to USEPA procedures and used deionized water and reagent grade chemicals. Concentrations in Table 3.3 can be thought of as background levels. Notice the level of lead. Levels of lead occurring near this level in the experiments reflect a background level. Table 3.4 lists concentrations of metals in the B-20 and B-24 soils collected in the field prior to any treatment. As a result of the batch tests, the preliminary column tests, and the many analyses performed on these soils by CSSA and Parsons ES, it was decided that the rest of the treatability study would concentrate on the B-20 soils. The B-20 soils are generally more contaminated and represent a worse case situation for the demonstration. Also, the B20 soils will be part of the field demonstration, whereas the B‑24 soils might be used for a future activity.
Preliminary batch leach tests were performed to see relative differences in leaching with and without Apatite II treatment. These batch tests were performed with no treatment (0 percent Apatite II added) and with Apatite II treatment (5 percent Apatite II by weight of soil), using SPLP and TCLP leach solutions. The subsequent column tests used both 2 percent and 5 percent Apatite II added to the soil. Because of the similarity in soil composition and because B20 soils appear to be more contaminated, B20 soils were used for most of the subsequent batch and column studies.
Table 3.3 - Metal Concentrations in the Tap Water used as Irrigation Water
| Metal | Concentration in ppm (mg/L) | Detection Limit |
| Arsenic | 0.01 | 0.01 |
| Antimony | 0.05 | 0.05 |
| Beryllium | 0.002 | 0.002 |
| Cadmium | 0.005 | 0.005 |
| Calcium | 19 | 0.5 |
| Chromium | 0.01 | 0.01 |
| Copper | 1 | 0.01 |
| Lead | 0.024 | 0.01 |
| Mercury | 0.0002 | 0.0002 |
| Nickel | 0.04 | 0.04 |
| Selenium | 0.05 | 0.05 |
| Silver | 0.01 | 0.01 |
| Total Halogens | 2.0 | 2.0 |
| Thallium | 0.038 | 0.01 |
| Zinc | 0.17 | 0.01 |
Table 3.4 - Metal Concentrations in the B-20 and B-24 Soil Piles Designated for Remediation in this Demonstration
| Soil | Metal | Concentration in ppm (mg/Kg) | Detection Limit |
| B-20 | Arsenic | 8.8 | 2.2 |
| B-20 | Antimony | 19 | 11 |
| B-20 | Beryllium | 0.95 | 0.44 |
| B-20 | Cadmium | 4.2 | 1.1 |
| B-20 | Calcium | 240,000 | 110 |
| B-20 | Chromium | 28 | 2.2 |
| B-20 | Copper | 120 | 2.2 |
| B-20 | Lead | 2,100 | 2.2 |
| B-20 | Mercury | 0.2 | 0.021 |
| B-20 | Nickel | 15 | 8.8 |
| B-20 | Selenium | 27 | 11 |
| B-20 | Silver | 2.0 | 2.2 |
| B-20 | Thallium | 2.2 | 2.2 |
| B-20 | Zinc | 140 | 2.2 |
| B-24 | Arsenic | 8.3 | 1.9 |
| B-24 | Antimony | 9.6 | 9.6 |
| B-24 | Beryllium | 0.94 | 0.38 |
| B-24 | Cadmium | 4.5 | 0.96 |
| B-24 | Calcium | 230,000 | 96 |
| B-24 | Chromium | 26 | 1.9 |
| B-24 | Copper | 210 | 1.9 |
| B-24 | Lead | 360 | 1.9 |
| B-24 | Mercury | 0.022 | 0.022 |
| B-24 | Nickel | 15 | 7.7 |
| B-24 | Selenium | 56 | 9.6 |
| B-24 | Silver | 1.9 | 1.9 |
| B-24 | Thallium | 1.9 | 1.9 |
| B-24 | Zinc | 410 | 1.9 |
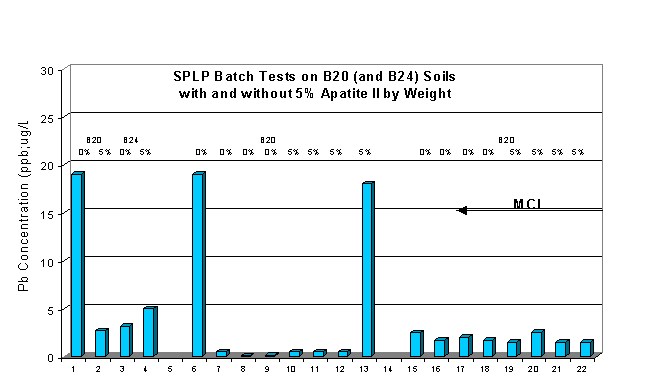
Figure 3.3 and Table 3.5 show results from the batch leach tests using the SPLP solution. Noticing that the scale of lead concentration is only up to 30 ppb and the MCL for lead is only 15 ppb, it appears that little lead leached from any of the soils with this solution. Of the three samples that showed leaching above the MCL, two were without Apatite II and one was with Apatite II, although all three were still less than 20 ppb. The rest were all below 5 ppb. The B-20 soil showed more contamination and leaching than the B-24 soil.
Figure 3.4 and Table 3.6 show results from the batch leach tests using the more aggressive TCLP solution. Again, noticing that the B-20 scale of Pb concentration is now up to 2,400 ppb, all soils showed significant lead leaching above the MCL. However, samples with Apatite II showed much less lead leaching than the ones without Apatite II. B-20 and B-24 soils showed almost identical behavior. On average, soils with Apatite II exhibited lead concentrations in the leachate between 5 and 10 times less than soils without Apatite II.
Figure 3.5 shows the column tests using the SPLP solutions, using soil with 5 percent Apatite II added and soil without Apatite II. Again, most samples were below the MCL for lead of 15 ppb. However, several leachate samples from the untreated soil column were above the MCL, especially at the beginning of the test, and one was almost 250 ppb. None of the leachate samples from the soil treated with 2 percent Apatite II showed significant lead concentrations. A few of the leachate samples from the soil treated with 5 percent Apatite II showed increasing contaminant concentrations towards the end of the 17-year equivalent run, but none exceeded 50 ppm.
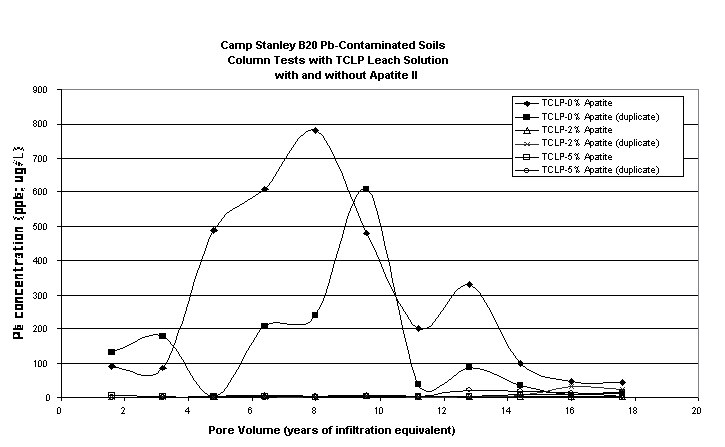
Figure 3.6 shows the column tests using the TCLP solutions with 5 percent Apatite II added and without Apatite II. Notice that the scale of Pb concentration is 900 ppb. The untreated soil exhibited significant Pb leaching at all times during the run at the hundreds of ppb levels. Again the soil treated with 2 percent Apatite II showed the least leaching of all samples with one sample never exceeding the MCL. For the other 2 percent treated soil only two out of 22 leachate samples showed over the MCL and then just 26 ppb and 43 ppb towards the end of the 17-year equivalent run. The same occurred for the 5 percent treated soil, i.e., one of the samples never exceeded the MCL for lead, while the other 5 percent treated soil showed only 21 ppb and 19 ppb towards the end of the 17-year equivalent run.
Table 3.5 - Three Groups of Batch Leach Tests for Lead using USEPA SPLP Solution on B-20 and B-24 Soils with and without Apatite II Treatment at 5 percent by Weight of Soil
| Soil | Apatite II (percent) | Lead Concentration in ppm (mg/L) | Detection Limit |
| B-20 | 0 | 0.019 | 0.0005 |
| B-20 | 5 | 0.0027 | 0.0005 |
| B-24 | 0 | 0.0032 | 0.0005 |
| B-24 | 5 | 0.0005 | 0.0005 |
| B-20 | 0 | 0.019 | 0.01 |
| B-20 | 0 | 0.01 | 0.01 |
| B-20 | 0 | 0.011 | 0.01 |
| B-20 | 0 | 0.016 | 0.01 |
| B-20 | 5 | 0.01 | 0.01 |
| B-20 | 5 | 0.01 | 0.01 |
| B-20 | 5 | 0.01 | 0.01 |
| B-20 | 5 | 0.018 | 0.01 |
| B-20 | 0 | 0.0025 | 0.0005 |
| B-20 | 0 | 0.0017 | 0.0005 |
| B-20 | 0 | 0.0020 | 0.0005 |
| B-20 | 0 | 0.0017 | 0.0005 |
| B-20 | 5 | 0.0015 | 0.0005 |
| B-20 | 5 | 0.0026 | 0.0005 |
| B-20 | 5 | 0.0015 | 0.0005 |
| B-20 | 5 | 0.0015 | 0.0005 |
Table 3.6 - Three Groups of Batch Leach Tests for Lead using USEPA TCLP Solution on B-20 and B-24 with and without Apatite II Treatment at 5 percent by Weight of Soil
| Soil | Apatite II (percent) | Lead Concentration in ppm (mg/L) | Detection Limit |
| B-20 | 0 | 1.0 | 0.0005 |
| B-20 | 5 | 0.13 | 0.0005 |
| B-24 | 0 | 0.86 | 0.0005 |
| B-24 | 5 | 0.13 | 0.0005 |
| B-20 | 0 | 0.34 | 0.01 |
| B-20 | 0 | 0.43 | 0.01 |
| B-20 | 0 | 0.40 | 0.01 |
| B-20 | 0 | 0.29 | 0.01 |
| B-20 | 5 | 0.17 | 0.01 |
| B-20 | 5 | 0.058 | 0.01 |
| B-20 | 5 | 0.087 | 0.01 |
| B-20 | 5 | 0.069 | 0.01 |
| B-20 | 0 | 2.0 | 0.0005 |
| B-20 | 0 | 2.1 | 0.0005 |
| B-20 | 0 | 1.8 | 0.0005 |
| B-20 | 0 | 1.7 | 0.0005 |
| B-20 | 5 | 0.73 | 0.0005 |
| B-20 | 5 | 0.41 | 0.0005 |
| B-20 | 5 | 0.74 | 0.0005 |
| B-20 | 5 | 0.52 | 0.0005 |
Figure 3.3 - Results from the Batch Leach Tests using the SPLP Solution
Figure 3.4 - Results from the Batch Leach Tests using the TCLP Solution
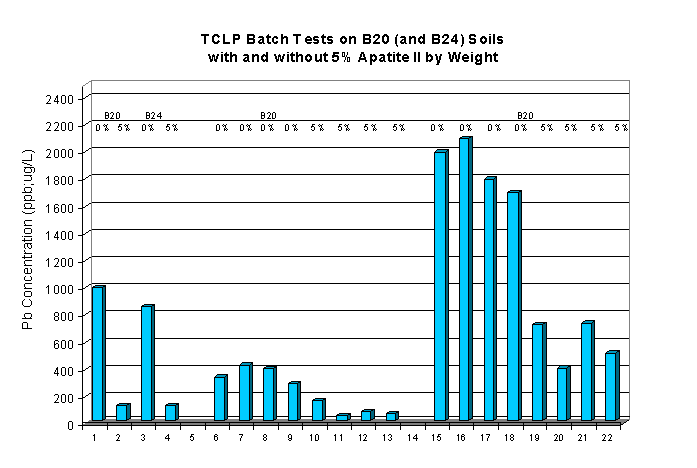
Figure 3.5 - Column Tests using the SPLP Solutions, using Soil with 5% Apatite II Added and Soil without Apatite II, in Duplicate
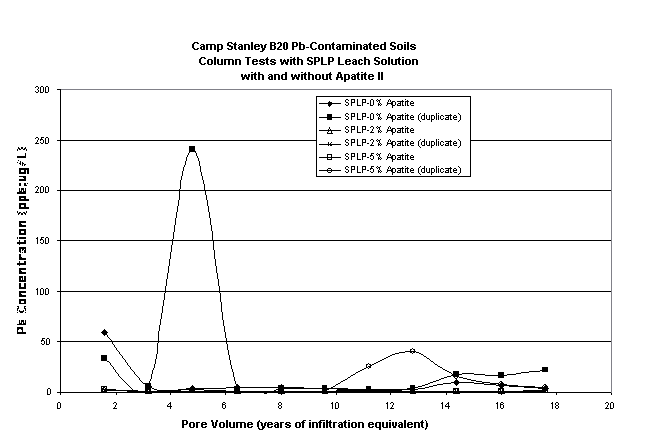
Figure 3.6 - Column Tests using the TCLP Solutions, using Soil with 5% Apatite II Added and Soil without Apatite II, in Duplicate
3.6 - Testing and Evaluation Plan
3.6.1 Demonstration Set-Up and Start-UpIt is anticipated that field activities will commence with site preparation activities. These activities include site grading, liner and leachate collection system construction, and emplacement of approximately 500 cubic yards of treated lead‑contaminated soils (see Figure 4.1). The treatment system will have a 10 cubic yard mixer with batch feeding of the PIMS material to provide thorough mixing of lead-contaminated soils and treatment material. Equipment expected to be used are construction related (e.g., bulldozer, grader, front end loader, batch mixer, etc.); accordingly, minimal equipment installation and shakedown will be required for the emplacement efforts.
For monitoring of the treatment area, it is anticipated that a water reuse and potentially a package water treatment system will be in operation to minimize the amount of water anticipated for treatment purposes. It is anticipated that as much as 1 million gallons of water will be allowed to filter through the treated soil to test efficacy of the PIMS treatment system. Therefore, in order to conserve water, it is anticipated that a water (leachate collection) reuse system will be installed to re-apply collected waters from the treatment area. This will also minimize the permitting effort. To release waters to the State of Texas, a Texas Pollutant Discharge Elimination System (TPDES) permit would be required. This process is cumbersome and expensive for a temporary discharge. It is anticipated that upon completion of the test, state and federal authorities will allow treatment of similar soils and disposition of the soils to remain at the generating site without the onerous permitting requirements.
The water reuse system is anticipated to have storage tank rented (sizing to be determined) for the duration of the field project with the necessary ancillary equipment (e.g., pump, piping, filtration, etc.). Provisions will also be made regarding the potential treatment of the generated leachate for mineralization contaminants expressed from the treated soils. However, benchscale results generated to date indicate the treatment system will not be required. Additionally, provisions will be made to cover the treatment unit in the event of a significant rainfall event (e.g., >2 inches/hr.) to prevent an overflowing of the leachate from the unit.
Sampling and Analysis Plan, Analytical Methods Supporting the Sampling Plan and Health and Safety Related issues are detailed in Appendices C, D, and F, respectively.
Field study, including monitoring, is expected to take 2 weeks to construct and 16 months to complete.
3.6.3 Amount /Treatment Rate of Material to be Treated
Approximately 500 cubic yards of contaminated soil will be treated in the field over 2 weeks of actual construction and handling time. This rate depends on the site and total amount handled. For larger activities the rate would be expected to decrease with more efficient and effective mixing operations (e.g., continuous mixing with pugmill).
Water passing through the treatment zone cannot be released to the surface without obtaining a TPDES permit modification, which will not be pursued. Alternatively, the water is expected to be collected and recycled. This also allows for water conservation as the region is prone to drought conditions during the summer months.
3.6.5 Operating Parameters for the Technology
Anticipated operating requirements include field construction efforts similar to those in construction of a landfill. Treatment of the soils will be accomplished in batch mode (i.e., 10 cubic yards per batch). Monitoring will be conducted on leachate generated from the treatment area on a quarterly basis. Additionally, monitoring of the soils through analytical data will occur to provide data regarding the effectiveness of the treatment system in rendering the waste to non-regulated materials.
The experimental design is identified as a cleanup remediation technology. As explained earlier, the effort includes treatment of approximately 500 cubic yards of lead-contaminated soils within the SWMU B-20 area. The soils are anticipated to have approximately 5 percent by volume of Apatite II material added and mixed sufficiently in 10 cubic yard batches. Additionally, a 2 to 4 inch layer of Apatite II material will underlie the treated soils to further ensure that all mobilized lead will be treated within the soil/Apatite II matrix. This field emplacement process is expected to require 2 weeks of field construction efforts. Detailed construction drawings and specifications will be developed for subcontractor bid costs. These detailed construction drawings and specifications will become part of the ESTCP PIMS Project 200020 Final Report incorporating the PIMS Field Demonstration monitoring test results. All analytical and sampling methods that will be used in supporting the experimental design are provided in Appendix B, the CSSA project related Sampling and Analysis Plan (included as Appendix C), and associated Quality Assurance Project Plan (QAPP) (included as Appendix E).
In this project, soil and water samples will be collected for chemical analysis, soil samples will also be collected for confirmation analysis, and other associated field operations will be carried out. Many field activities have widely recognized standard procedures, such as the USEPA Solid Waste (SW) 846 method, while others allow some latitude in techniques. The equipment required for the various activity ranges in complexity from tape measures to organic vapor monitoring instruments. Parsons ES has developed field procedures to ensure that field activities at the study site are performed in a consistent manner to meet QA/QC objectives.
A sampling plan for the collection of analytical data and sampling methods that may be employed at the site for this demonstration is located in a separate document developed for the CSSA environmental program and included as Appendix C of this work plan. Sampling and analysis will follow the outlined procedures for collection of soils and water (leachate) during the operation and monitoring of the field demonstration effort.
All anticipated analytical methods are specified within the SAP and associated QAPP and follow USEPA guidance specified in SW-846 Analytical Methods. Additionally, as part of the SAP a field sampling plan is included to provide standard procedures for the collection of all sample media types. The SAP is located in Appendix C.
Upon completion of the field demonstration project, the site demonstration area will be returned to its original condition. The treated soils will be removed from the lined area and the liner and leachate collection system dismantled. Ultimate disposition of the treated soils has yet to be determined. It is expected that field demonstration results will indicate the potential of leaving the soils in-place. However, it is CSSA�s decision to provide for the disposition of these soils and ultimately closure of the SWMU.
3.6.9 Health and Safety Plan (HASP)
A Health and Safety Plan (HASP) for field activities is provided in Appendix F.
3.7 - Selection of Analytical/Testing Methods
Each sample collected for soil and water will be analyzed for lead by USEPA SW-846 method 6010a. Additional parameters may be tested if necessary. All analytical samples will utilize the appropriate USEPA SW-846 method. The SAP and the installation QAPP are located in Appendix C and E, respectively. These plans denote how the samples will be gathered, analyzed, and the QA/QC samples that are expected to be collected.
3.8 - Selection of Analytical/Testing Laboratory
It is expected that Agriculture & Priority Pollutants Laboratories, Inc. (APPL) will perform the analytical analyses for this demonstration effort. APPL is located at 4203 West Swift, Fresno, CA. 93722 attention Diane Anderson. Phone number 559-275-2175 and facsimile number 559-275-4422.
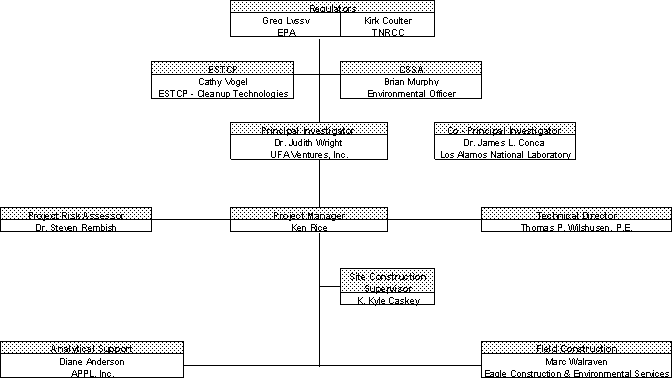
Dr. Judith Wright, President of UFAV, will serve as ESTCP Program Manager and Co-PI. She will provide program oversight and review, develop reports, track budgets, and communicate all programmatic issues to ESTCP. It is her responsibility to ensure that all ESTCP and PIMS project objectives are fulfilled.
Dr. James L. Conca, Scientist and Program Manager at Los Alamos National Laboratory, will serve as ESTCP Technical Program Manager and Co-PI. He will provide technical support, guidance, and review of all aspects of the PIMS project and report them to Dr. Wright. It is his responsibility to ensure that all technical requirements and objectives of ESTCP and the PIMS project are fulfilled.
Ken Rice of Parsons ES Austin, Texas office will serve as project manager. He will implement a management approach based on the project scope and background. The project manager will develop strategy, oversee project planning, review administrative procedures, and track the project budget. He will be responsible for scheduling and coordinating all work efforts at the Parsons ES offices and at the site, and will continually track the overall progress of the project. The project manager will regularly communicate with Judith Wright, Ph.D. of UFA (the principal investigator [PI]) to provide a brief of the project progress and to schedule site visits, as necessary. The project manager will track labor hours and cost budgets. Job cost summaries, organized by work breakdown structure, will be provided to the project manager through the Parsons ES PRISM cost management system.
Thomas P. Wilshusen P.E. of the Parsons ES Austin, Texas office will serve as overall technical director for the project. The technical director will provide technical guidance and oversight to meet the project�s technical objectives. The technical director may assign a technical manager to assist in specialized areas of this delivery order.
Dr. John Yu of the Parsons ES Austin, Texas office will serve as QA/QC Officer for the project. The Parsons Quality Assurance Program Plan will be the guiding plan for the project QA/QC control. Compliance with the plan will ensure that highest quality deliverables are produced to meet the Air Force quality requirements. The QA/QC Officer will ensure that all team members clearly understand their assigned tasks, milestones, schedules, deliverables, and QA/QC requirements and procedures.
Dr. Steve Rembish of the Parsons ES Austin, Texas office will serve as principal risk assessor for the project. As principal risk assessor, Dr. Rembish will provide technical guidance and support for evaluating the risk to human health and the environment from the field demonstration data generated.
Kyle Caskey, a senior construction supervisor with Parsons ES San Antonio, Texas office will be responsible for field oversight.
Figure 3.7 - Wiring Diagram
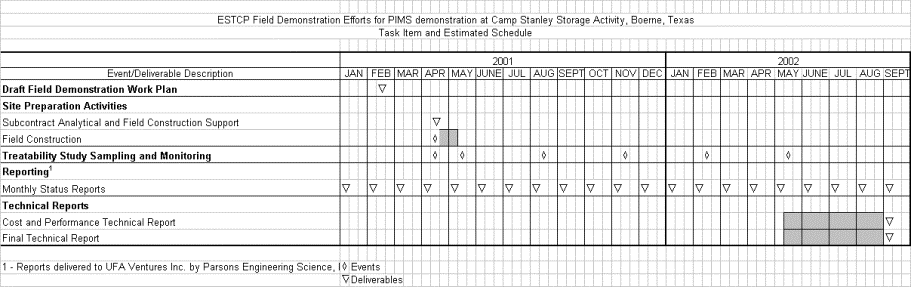
A Gantt chart showing the anticipated schedule of the field demonstration project is shown in Figure 3.8.
Figure 3.8 - Gantt Chart